Resilient Supply Chains: A graph-based optimization approach
What happens when a country that supplies a critical commodity suddenly can't?
For Jordan Andersen, that's the question behind Resilient Supply Chains, a graph-based tool that models commodity trade networks and explores how they might adapt when a global shock disrupts a major supplier's exports. The idea seems straightforward, but is surprisingly difficult to model. Disruptions to global trade can ripple far beyond the original event, affecting prices, availability, and other trade relationships around the world. Jordan wanted to make those dynamics visible and interactive rather than treating the supply chain as an abstract system.
Her approach represents a commodity's supply chain as a network, with countries as nodes and import and export quantities as relationships between them. The model uses trade data from UN Comtrade and three different routing approaches to compare possible responses to a disruption.
The finished tool lets a user choose a country, set the severity of a disruption, and specify how much spare capacity other suppliers have available to absorb the loss. The model then shows which trade relationships become stressed, which expand, and where entirely new relationships might need to form.
Jordan’s simulation of Saudi Arabia losing 45% of export capacity. Other exporting countries have an assumed excess capacity of 20%.
In one scenario, a 30% disruption to Saudi Arabia's crude oil exports removes roughly $56 billion in trade value, about 4.2% of the network's total. The model finds ways to absorb some of that loss through existing relationships, such as South Korea leaning more heavily on Canada, while also identifying places where new trade relationships might need to emerge.
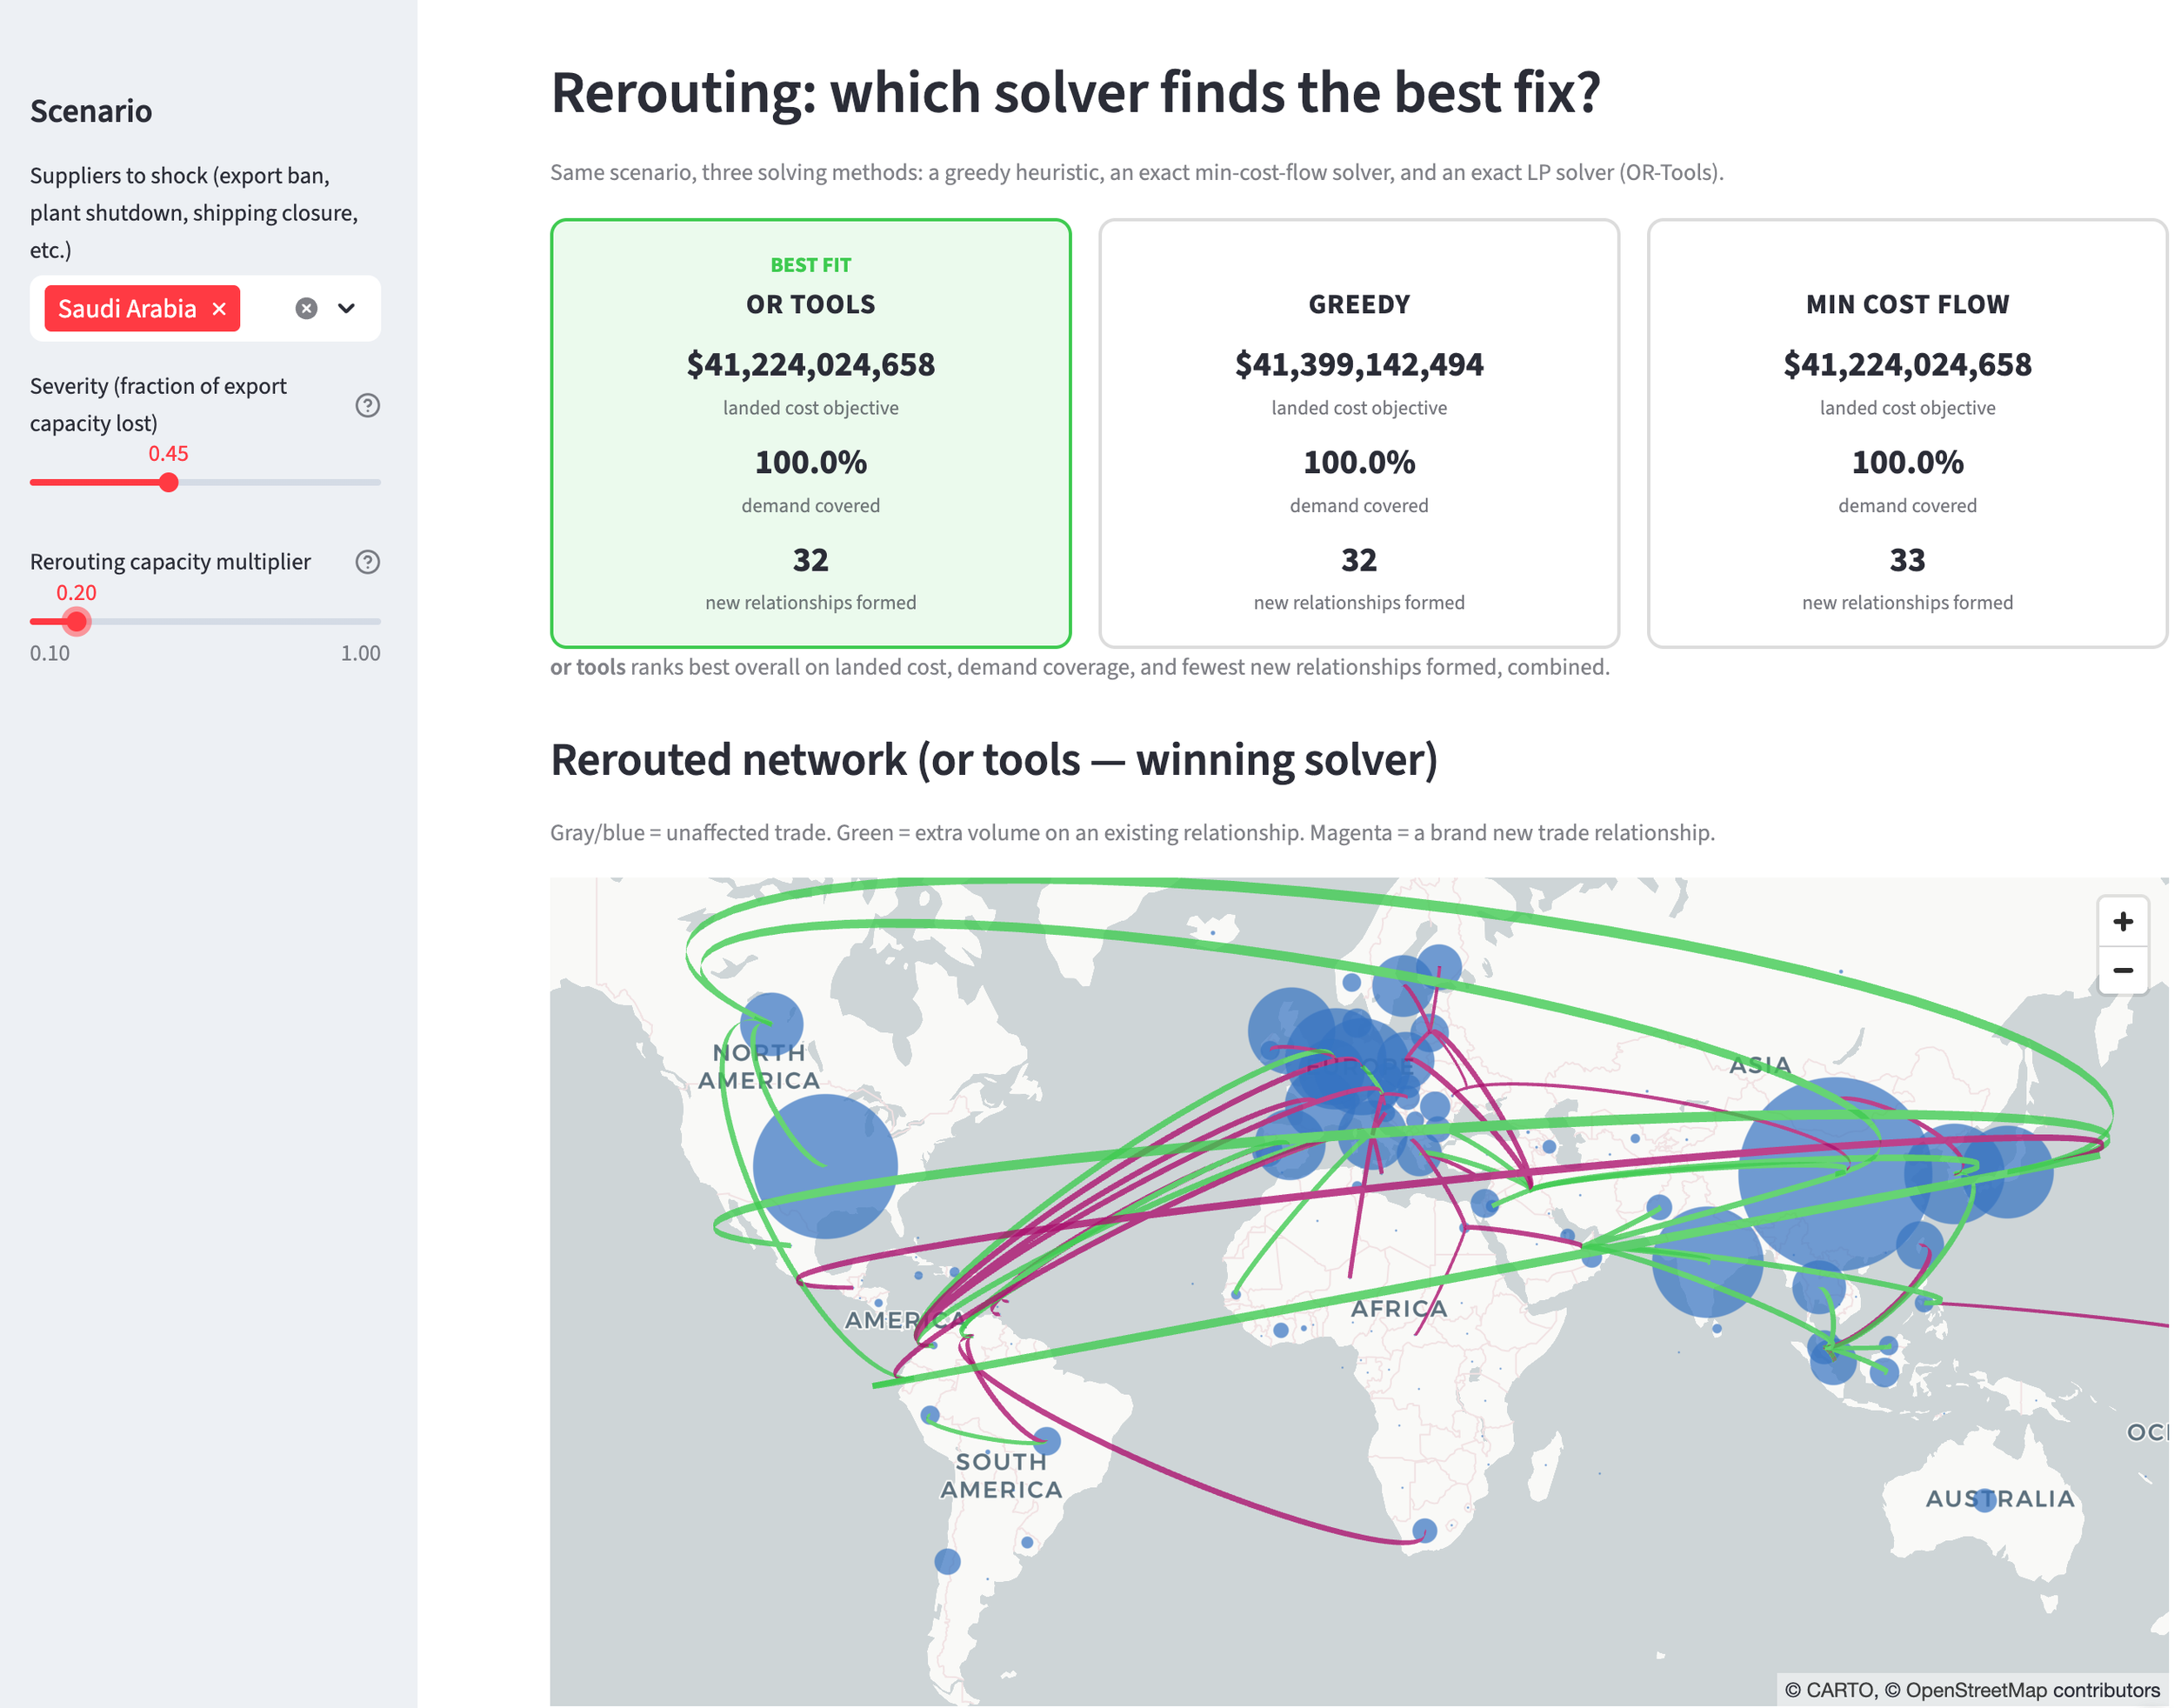
OR Tools optimization solver finds the best rerouting options based on lower costs, demand covered, and minimum new relationships created.
Behind that relatively clean interaction is a much messier technical problem. Jordan started with UN Comtrade data and built a directed trade-value graph using NetworkX. She then developed a simulation for removing nodes and evaluating what happened to the network, eventually building three different routing approaches: a greedy baseline and two additional solvers using NetworkX and OR-Tools. The goal wasn't simply to find a way to reroute the network, but to compare different approaches to the optimization problem.
That optimization turned out to be one of the steepest parts of the learning curve. Jordan talked to a supply-chain subject matter expert to better understand how the problem should actually be framed, rather than treating the mathematics as an isolated coding exercise.
Some of the hardest decisions were about what not to build, and about understanding what the available data could, and could not, represent. Jordan explored adding transportation-mode data and port-level nodes to make the model more realistic, but shelved those ideas when she found that the available data wasn't sufficient to make them useful. She also wasn't able to find open-source global port data that would support the approach she had in mind.
Those decisions are part of what makes the project interesting. Jordan came into Hack Your Summer with a UC Berkeley Master's in Information and Data Science and a background in international development, but not with a fully formed project waiting to be built. As she put it early in the program, she had some brain fog when trying to think about what to build. Rather than waiting for inspiration, she started talking to other HYS participants and narrowing her focus until she found one that was both consequential and tractable enough to tackle in four weeks.
The result is a learning project, not a production forecasting system. The current model makes simplifying assumptions, including equal spare capacity across countries, and its underlying trade data is from 2024 rather than live. Next, Jordan wants to incorporate real-time tariff and shipping data, bringing the simulation closer to the conditions companies and policymakers are actually responding to.
The project has already produced some promising next steps. One mentor connected Jordan with people working on supply-chain and optimization problems, and during her final demo, another offered to introduce her to risk management experts to explore whether there might be a real use for the tool.
That's perhaps the most revealing part of the project. Four weeks was enough to go from "I need to figure out what to build" to a working model of a genuinely complicated system, and far enough to make people outside the program ask what it could become.
Check out Jordan’s Streamlit application for Supply Chain Vulnerability Mapping here: https://supply-chain-mapping-hys.streamlit.app/
