Stories from Hack Your Summer
Hack Your Summer is a community built around learning by doing. Explore stories from students, mentors, and organizers, discover the projects taking shape this summer, and find practical insights on building, collaborating, and launching your career.
Resilient Supply Chains: A graph-based optimization approach
What happens when a major supplier suddenly can't deliver? Jordan Andersen's graph-based simulation explores how global trade networks could reroute around a disruption, using real-world trade data and optimization algorithms.
What happens when a country that supplies a critical commodity suddenly can't?
For Jordan Andersen, that's the question behind Resilient Supply Chains, a graph-based tool that models commodity trade networks and explores how they might adapt when a global shock disrupts a major supplier's exports. The idea seems straightforward, but is surprisingly difficult to model. Disruptions to global trade can ripple far beyond the original event, affecting prices, availability, and other trade relationships around the world. Jordan wanted to make those dynamics visible and interactive rather than treating the supply chain as an abstract system.
Her approach represents a commodity's supply chain as a network, with countries as nodes and import and export quantities as relationships between them. The model uses trade data from UN Comtrade and three different routing approaches to compare possible responses to a disruption.
The finished tool lets a user choose a country, set the severity of a disruption, and specify how much spare capacity other suppliers have available to absorb the loss. The model then shows which trade relationships become stressed, which expand, and where entirely new relationships might need to form.
Jordan’s simulation of Saudi Arabia losing 45% of export capacity. Other exporting countries have an assumed excess capacity of 20%.
In one scenario, a 30% disruption to Saudi Arabia's crude oil exports removes roughly $56 billion in trade value, about 4.2% of the network's total. The model finds ways to absorb some of that loss through existing relationships, such as South Korea leaning more heavily on Canada, while also identifying places where new trade relationships might need to emerge.
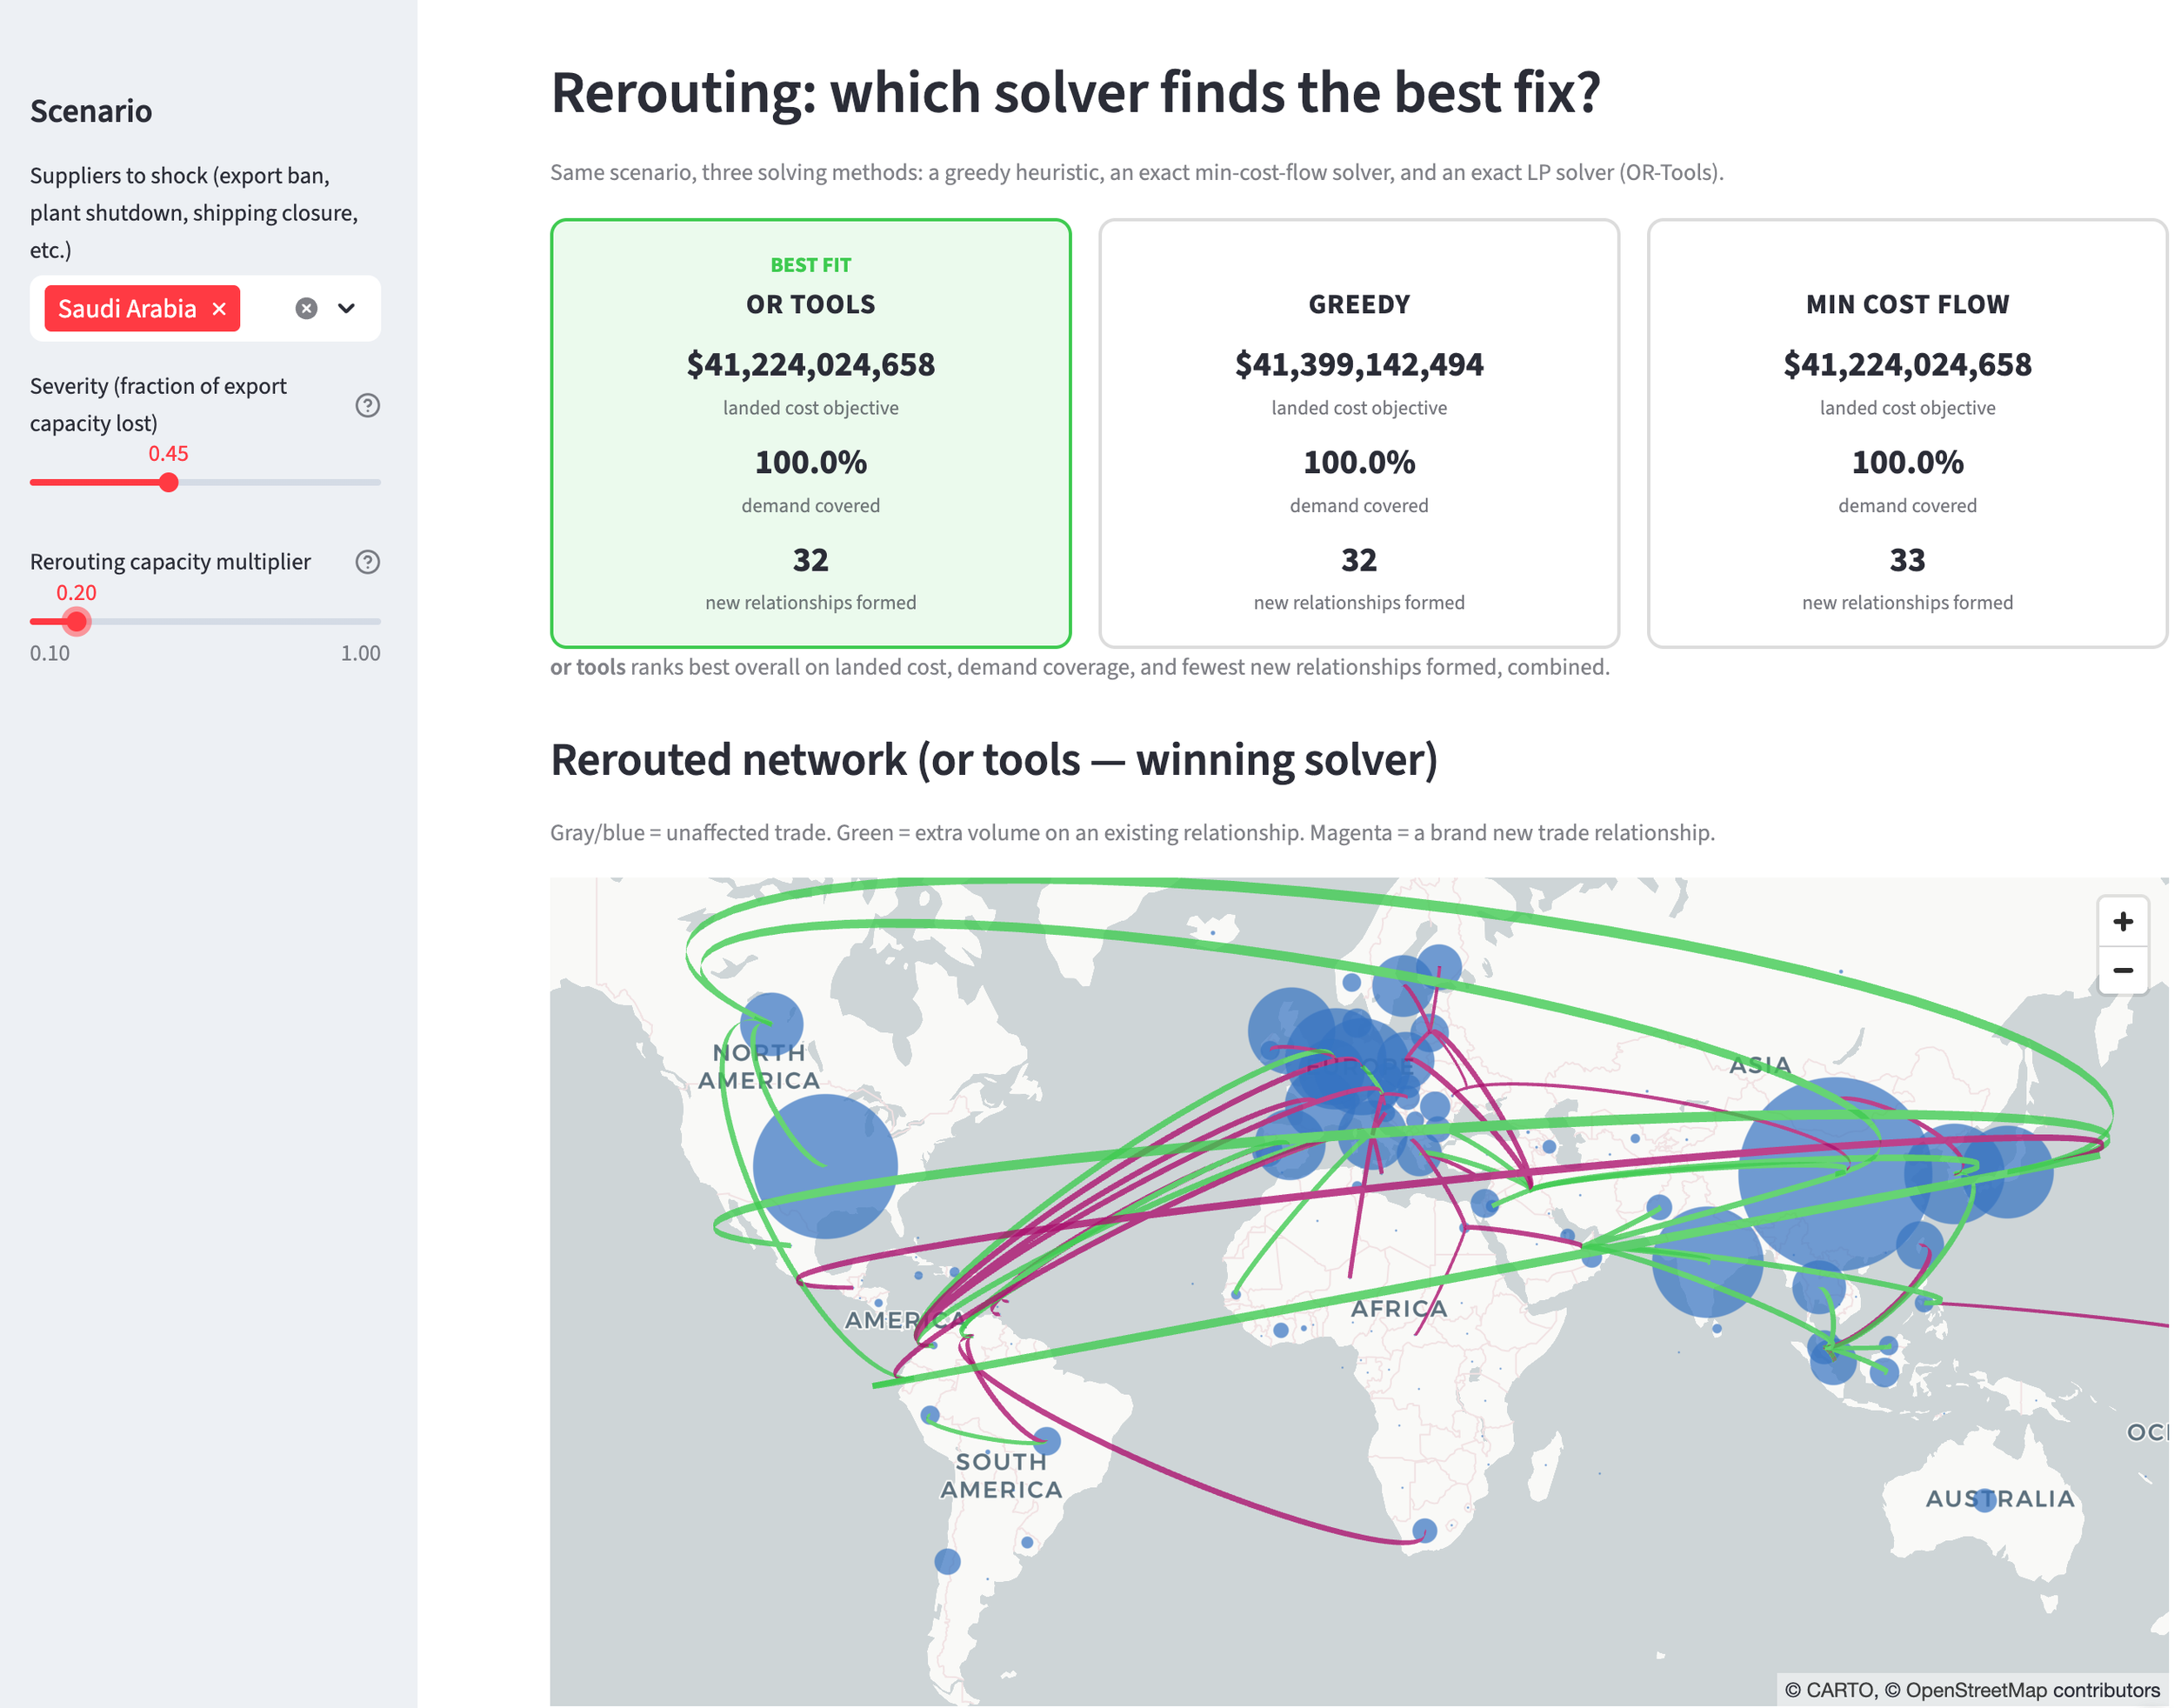
OR Tools optimization solver finds the best rerouting options based on lower costs, demand covered, and minimum new relationships created.
Behind that relatively clean interaction is a much messier technical problem. Jordan started with UN Comtrade data and built a directed trade-value graph using NetworkX. She then developed a simulation for removing nodes and evaluating what happened to the network, eventually building three different routing approaches: a greedy baseline and two additional solvers using NetworkX and OR-Tools. The goal wasn't simply to find a way to reroute the network, but to compare different approaches to the optimization problem.
That optimization turned out to be one of the steepest parts of the learning curve. Jordan talked to a supply-chain subject matter expert to better understand how the problem should actually be framed, rather than treating the mathematics as an isolated coding exercise.
Some of the hardest decisions were about what not to build, and about understanding what the available data could, and could not, represent. Jordan explored adding transportation-mode data and port-level nodes to make the model more realistic, but shelved those ideas when she found that the available data wasn't sufficient to make them useful. She also wasn't able to find open-source global port data that would support the approach she had in mind.
Those decisions are part of what makes the project interesting. Jordan came into Hack Your Summer with a UC Berkeley Master's in Information and Data Science and a background in international development, but not with a fully formed project waiting to be built. As she put it early in the program, she had some brain fog when trying to think about what to build. Rather than waiting for inspiration, she started talking to other HYS participants and narrowing her focus until she found one that was both consequential and tractable enough to tackle in four weeks.
The result is a learning project, not a production forecasting system. The current model makes simplifying assumptions, including equal spare capacity across countries, and its underlying trade data is from 2024 rather than live. Next, Jordan wants to incorporate real-time tariff and shipping data, bringing the simulation closer to the conditions companies and policymakers are actually responding to.
The project has already produced some promising next steps. One mentor connected Jordan with people working on supply-chain and optimization problems, and during her final demo, another offered to introduce her to risk management experts to explore whether there might be a real use for the tool.
That's perhaps the most revealing part of the project. Four weeks was enough to go from "I need to figure out what to build" to a working model of a genuinely complicated system, and far enough to make people outside the program ask what it could become.
Check out Jordan’s Streamlit application for Supply Chain Vulnerability Mapping here: https://supply-chain-mapping-hys.streamlit.app/
AI Writes the Satellite Mission. The Validation System Decides If It's Safe.
What happens when you ask an AI to write code that will eventually control a piece of hardware? For Damon Rocha, a master's student in Computer Science at Georgia Tech specializing in robotics and computer architecture, the answer is: don't let the AI be in charge.
What happens when you ask an AI to write code that will eventually control a piece of hardware? For Damon Rocha, a master's student in Computer Science at Georgia Tech specializing in robotics and computer architecture, the answer is: don't let the AI be in charge.
His Hack Your Summer project, COR-SAT, starts with a deceptively simple idea: what if you could tell a satellite payload what to do in plain English, and the system figured out the rest?
The "rest" is a lot! When you type a mission request into COR-SAT, say, "capture seven images at three-second intervals and send a heartbeat before every capture," the system converts that request into typed requirements, generates Python mission code using a local language model, and runs the result through a seven-step validation pipeline before it ever reaches hardware. The pipeline checks syntax, verifies that the generated code only imports what it is allowed to import, runs the mission against a fake SDK (software development kit) to simulate execution, checks timing and heartbeat behavior, and validates the final package against the runner schema. If the first generated candidate fails, a more robust generator tries again. If both candidates fail, the system attempts one repair. Only after passing every check does a mission become a package that can be deployed.
The design choice that makes this work is intentional and worth stating plainly: the language model generates text, but it never writes project files. Every actual write, packaging decision, and hardware interaction goes through a deterministic controller that validates rather than trusts. That separation matters when you're deploying to a Raspberry Pi-based satellite payload.
Alongside the software, Damon built out the hardware. He set up a Raspberry Pi and cameras, wrote a Rust hardware abstraction layer and mission runner, and designed an infrared communications system. The camera payload, timed capture and heartbeat missions, shutdown handling, and sparse optical flow are now working. Mission supervision and logs run on Linux and Raspberry Pi OS.
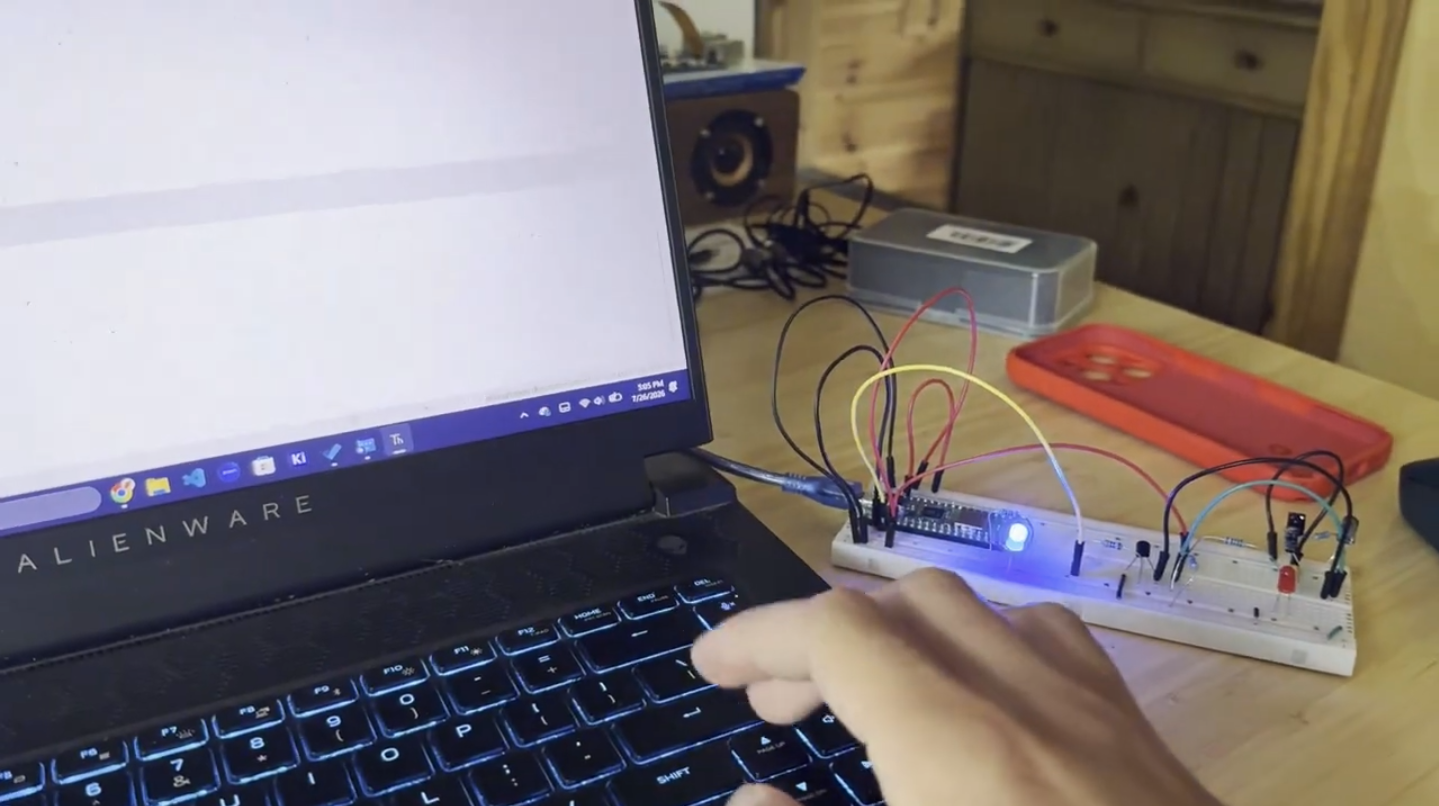
Damon testing a light-based communication system.
Other pieces are still in development. The infrared communications hardware has reached the breadboard and KiCad prototype stage, with a PCB layout, schematic, and STEP models in place, but the communications link is not yet part of the mission API. IMU and actuator support are also still to come.
The result is a system that makes a deceptively complicated question tangible: how do you use AI to generate executable code for a safety-constrained embedded system without letting the AI control the parts that actually matter?
COR-SAT's answer is to put the language model inside a much stricter system. The model can propose code. The deterministic controller decides whether that code meets the requirements, passes the checks, becomes a deployable package, and gets anywhere near the hardware. It's an architecture that has applications well beyond satellites, anywhere AI-generated code needs to operate within hard constraints.
Damon is now pushing the idea beyond the original CubeSat-style prototype. He's building a custom version of TARS-AI, an open-source recreation of the TARS robot from the film Interstellar that combines a Raspberry Pi, cameras, AI, and servo-driven movement. The physical build is nearing completion, with the torso and arm mechanisms assembled and the remaining structural parts being printed.
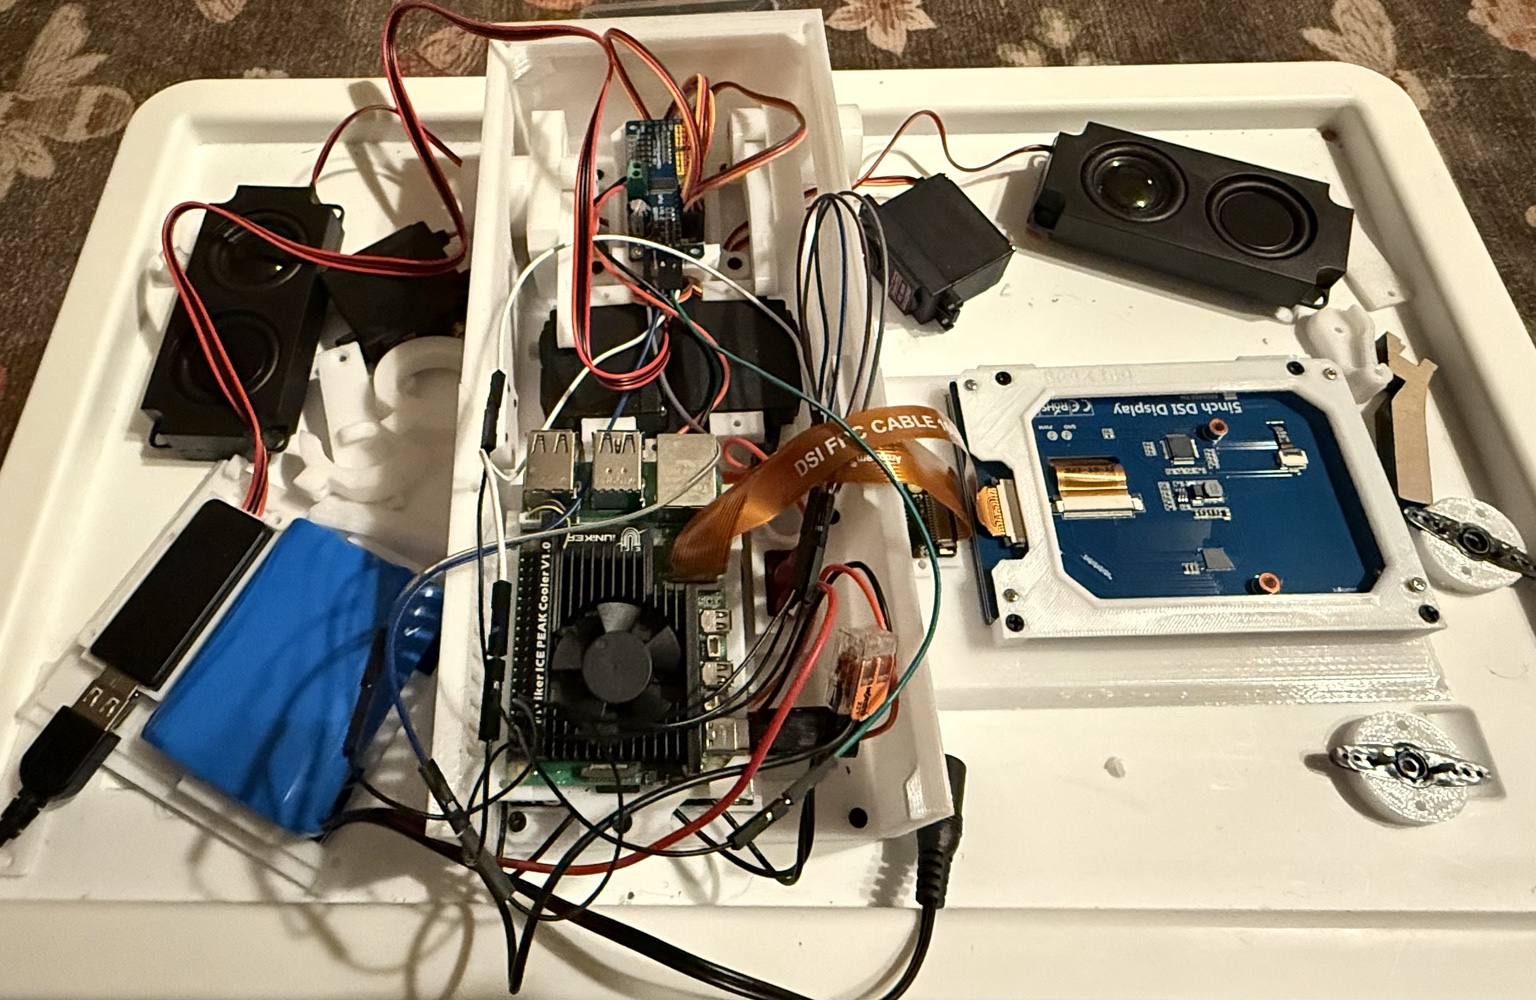
TARS robot with internal components disassembled.
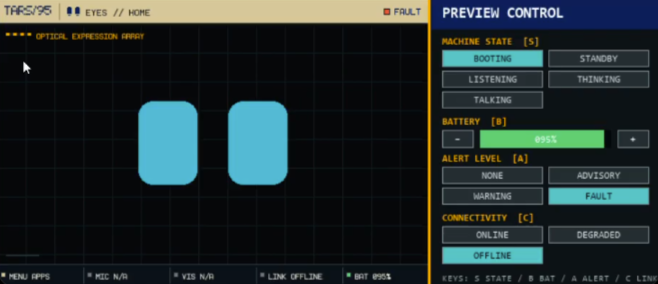
Updated TARS UI testing application.
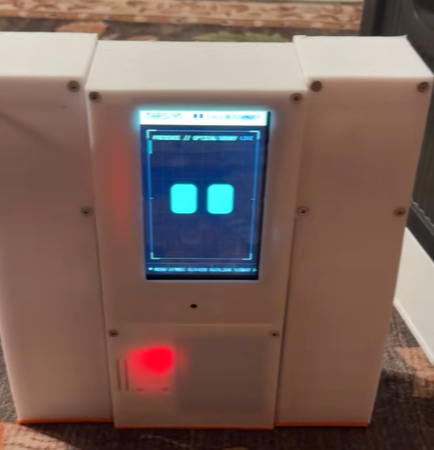
Full TARS v1 build running the custom TARS operating system.
Once TARS is ready, Damon plans to adapt COR-SAT's modular mission software and onboard AI to run on the robot. That will give him a physical platform for testing whether the same approach to autonomous mission planning, computer vision, hardware control, and fault-tolerant software can transfer from a simulated small-satellite environment into robotics.
For a project that started with a question about talking to a satellite in plain English, that's a pretty ambitious next step.
Check out COR-SAT yourself (and follow along with future updates) at https://github.com/dmarcr1997/COR-SAT, along with Damon’s forked version of the TARS Project here https://github.com/dmarcr1997/TARS95.
Mapping a Path for Rural Democratic Campaigns
Nish Barot built a tool for rural Democratic campaigns in Pennsylvania. It just crossed its first state line.
Nish Barot built a tool for rural Democratic campaigns in Pennsylvania. It just crossed its first state line.
A year ago, Nish Barot was a recent Penn State grad working as an engineer. Then he got laid off. He came back to Centre County, in the rural middle of Pennsylvania, and did something unexpected: he walked into his local Democratic office and asked how he could help.
He started writing postcards. Then he began driving around the district with his congressional candidate and campaign manager. And he started listening. Over the summer Nish had roughly 30 conversations across Pennsylvania, Maine, and Kansas, with campaign managers, candidates, county chairs, a state party regional director, and people who study progressive campaign technologies for a living. What he heard was frustration. Campaign data doesn’t live in one place. Instead it lives on paper sign-in sheets, in Google Drive, in text threads, and in tools that cost thousands of dollars a year. Getting data out of VAN, the standard tool most campaigns are stuck with, is "everyone's blocker." Older volunteers struggle with it. And nobody, anywhere, had their volunteer list in one place.
Nish had no political background. He had a degree in Human-Centered Design & Development, a builder's instinct, and a real problem in front of him. That combination became InvolveOS: a map-based volunteer and donor platform that helps rural Democratic campaigns see where their people are, where they aren't, and where to spend the little time and money they have.
InvolveOS starts by mapping volunteers. A campaign uploads its spreadsheet (however messy), the tool repairs the fields it can, flags the ones it can't, catches duplicate records, and plots everyone by county and town. And instead of just showing that a precinct is shifting politically, it shows precincts that are shifting where the campaign has nobody on the ground. A very useful thing to know when you're deciding where to send the three people you have on a Saturday.
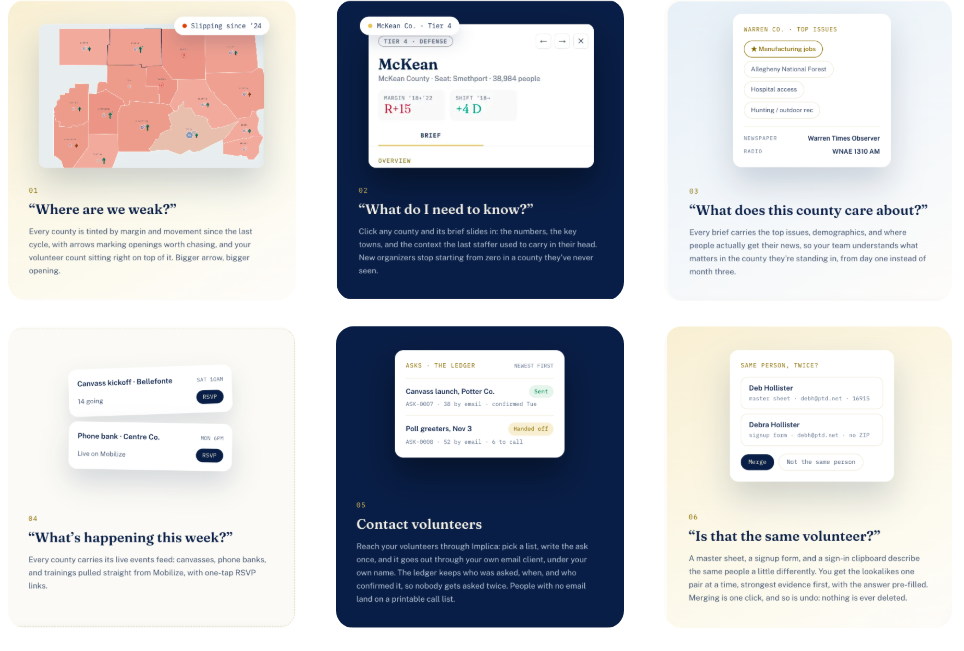
InvolveOS features, as described on the product landing page, answer every question a campaign field director might ask, from “Where are we weak?” when looking at a map to “Is that the same volunteer?” when looking at a new sign-up.
Many of the features Nish decided to build into InvolveOS came directly from watching campaigns work. For example, rural volunteer recruitment still runs largely on paper: a clipboard at a meet-and-greet, a sign-in sheet at a county dinner. Using InvolveOS, a staffer can photograph that sheet on their phone, which the app reads and lets them check every name before it lands in the roster. And because the person taking the picture is the same person uploading it, usually on the go, the web application works natively on a phone.
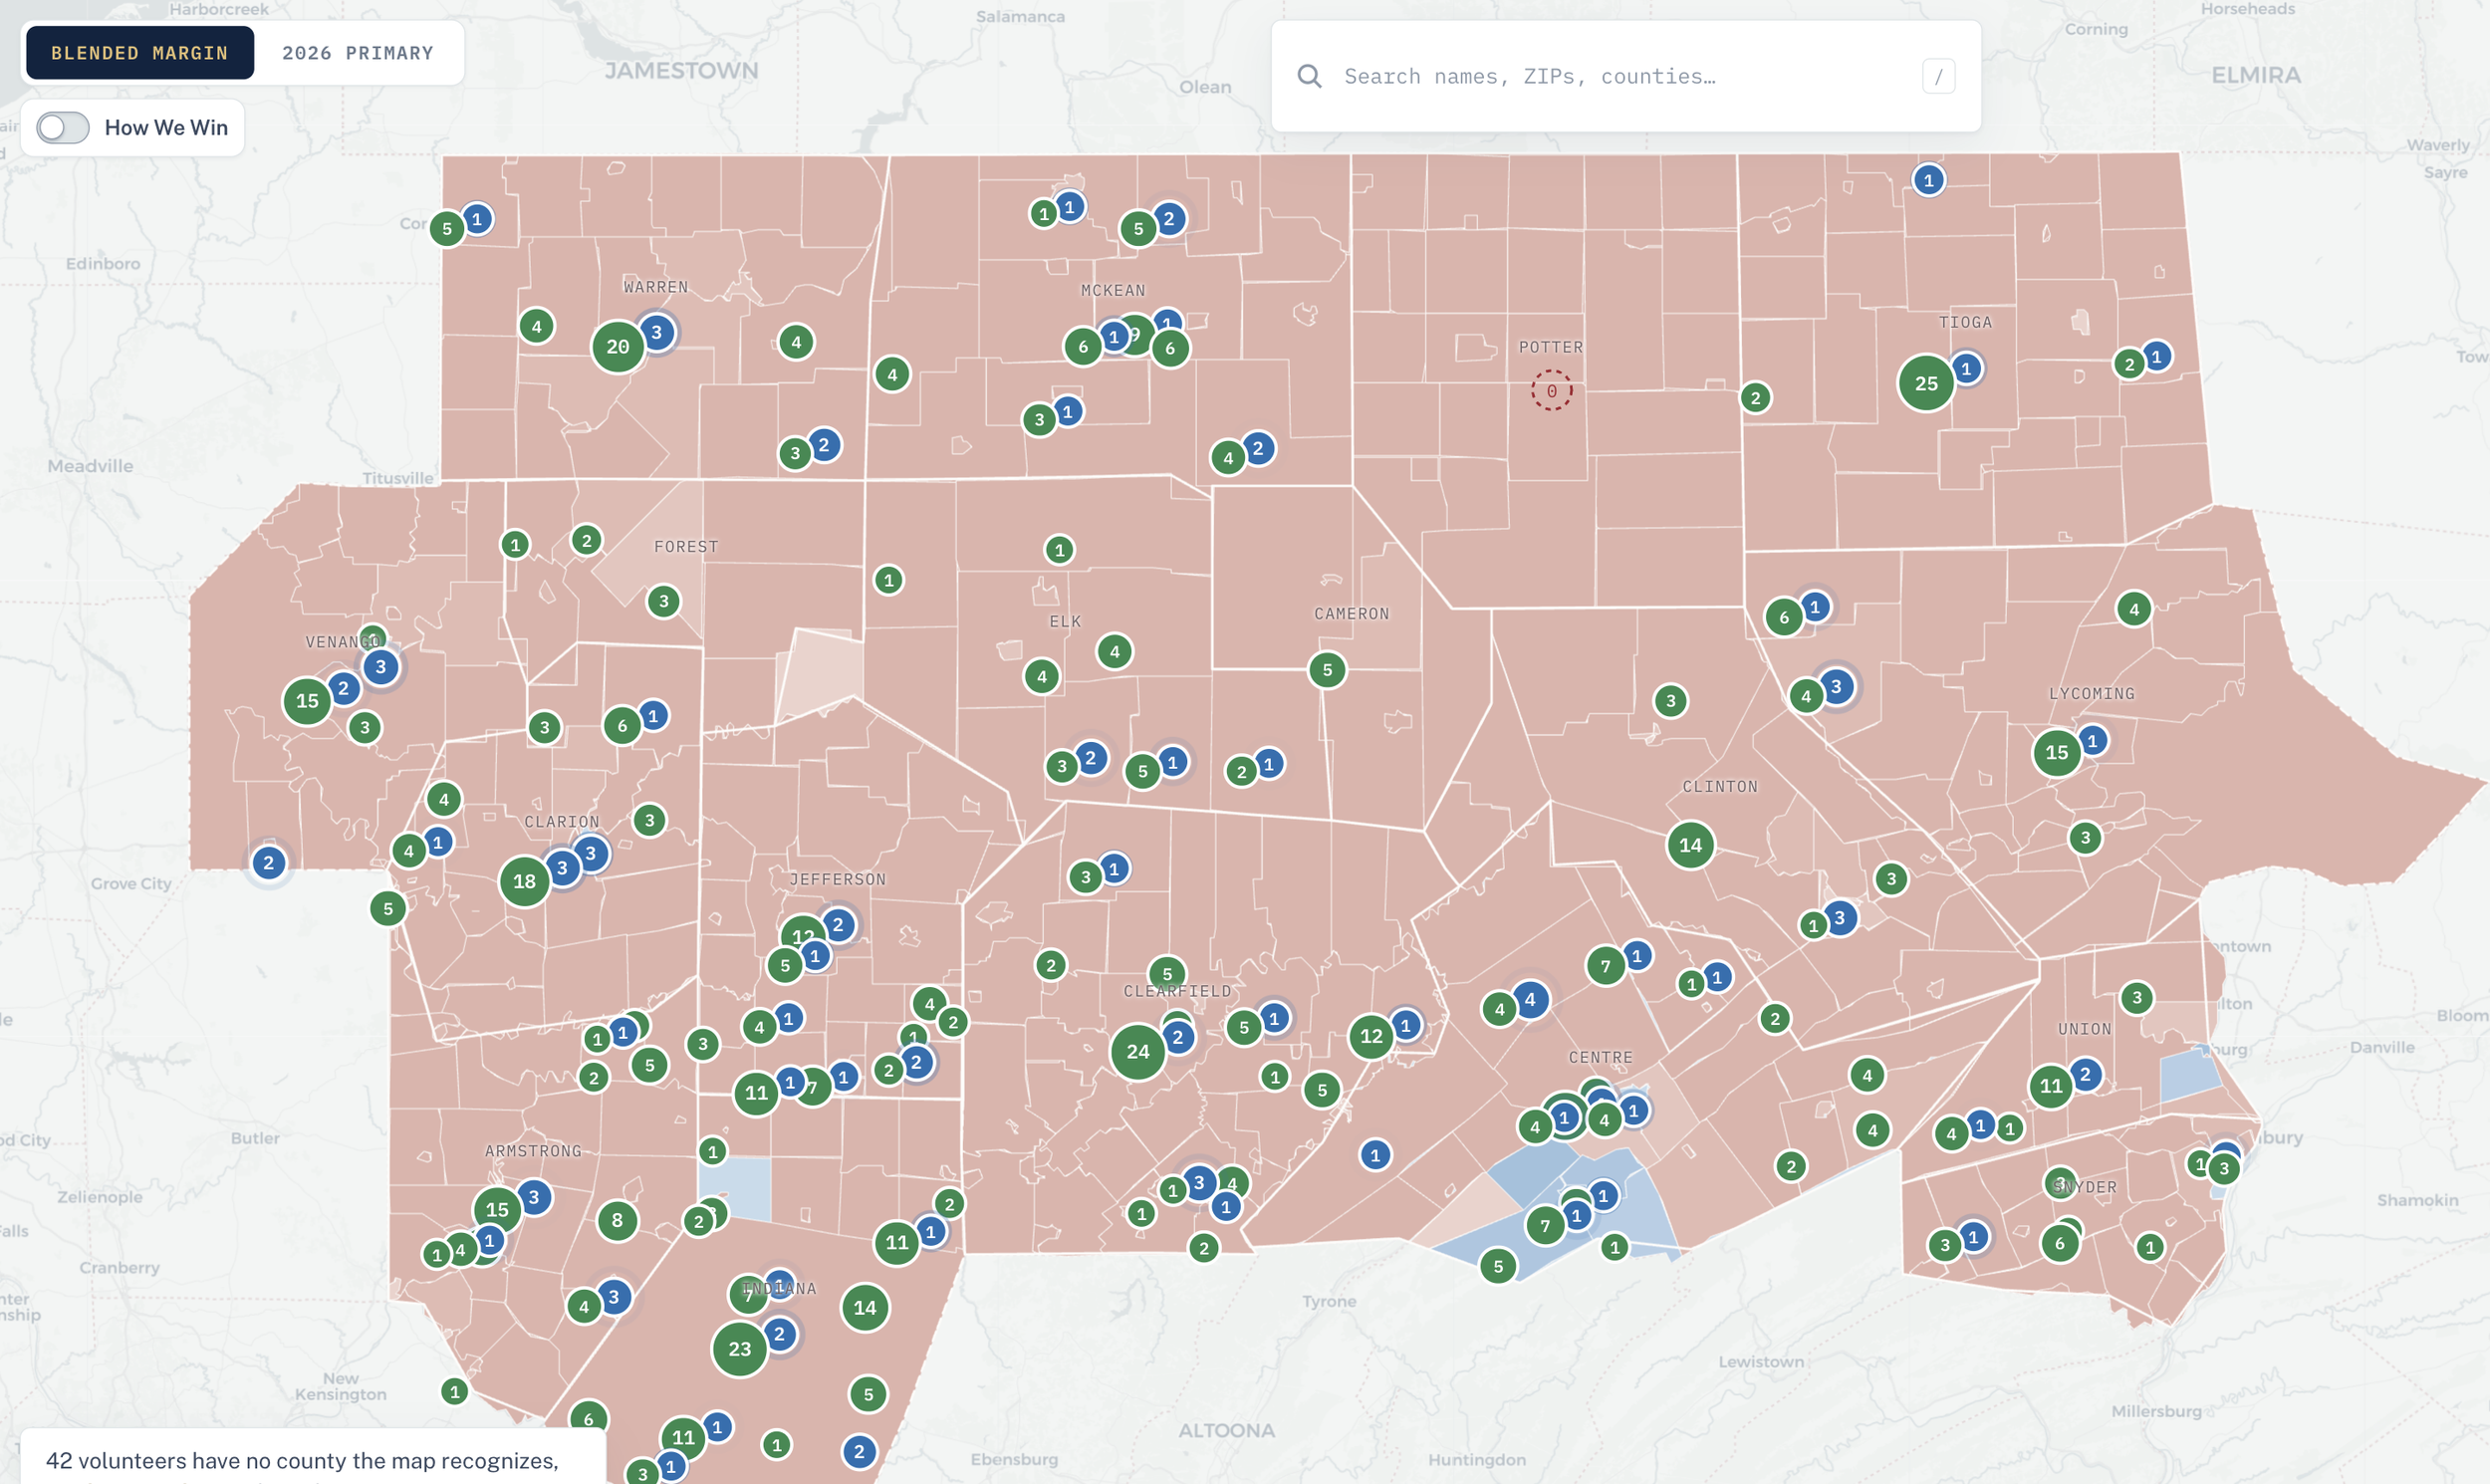
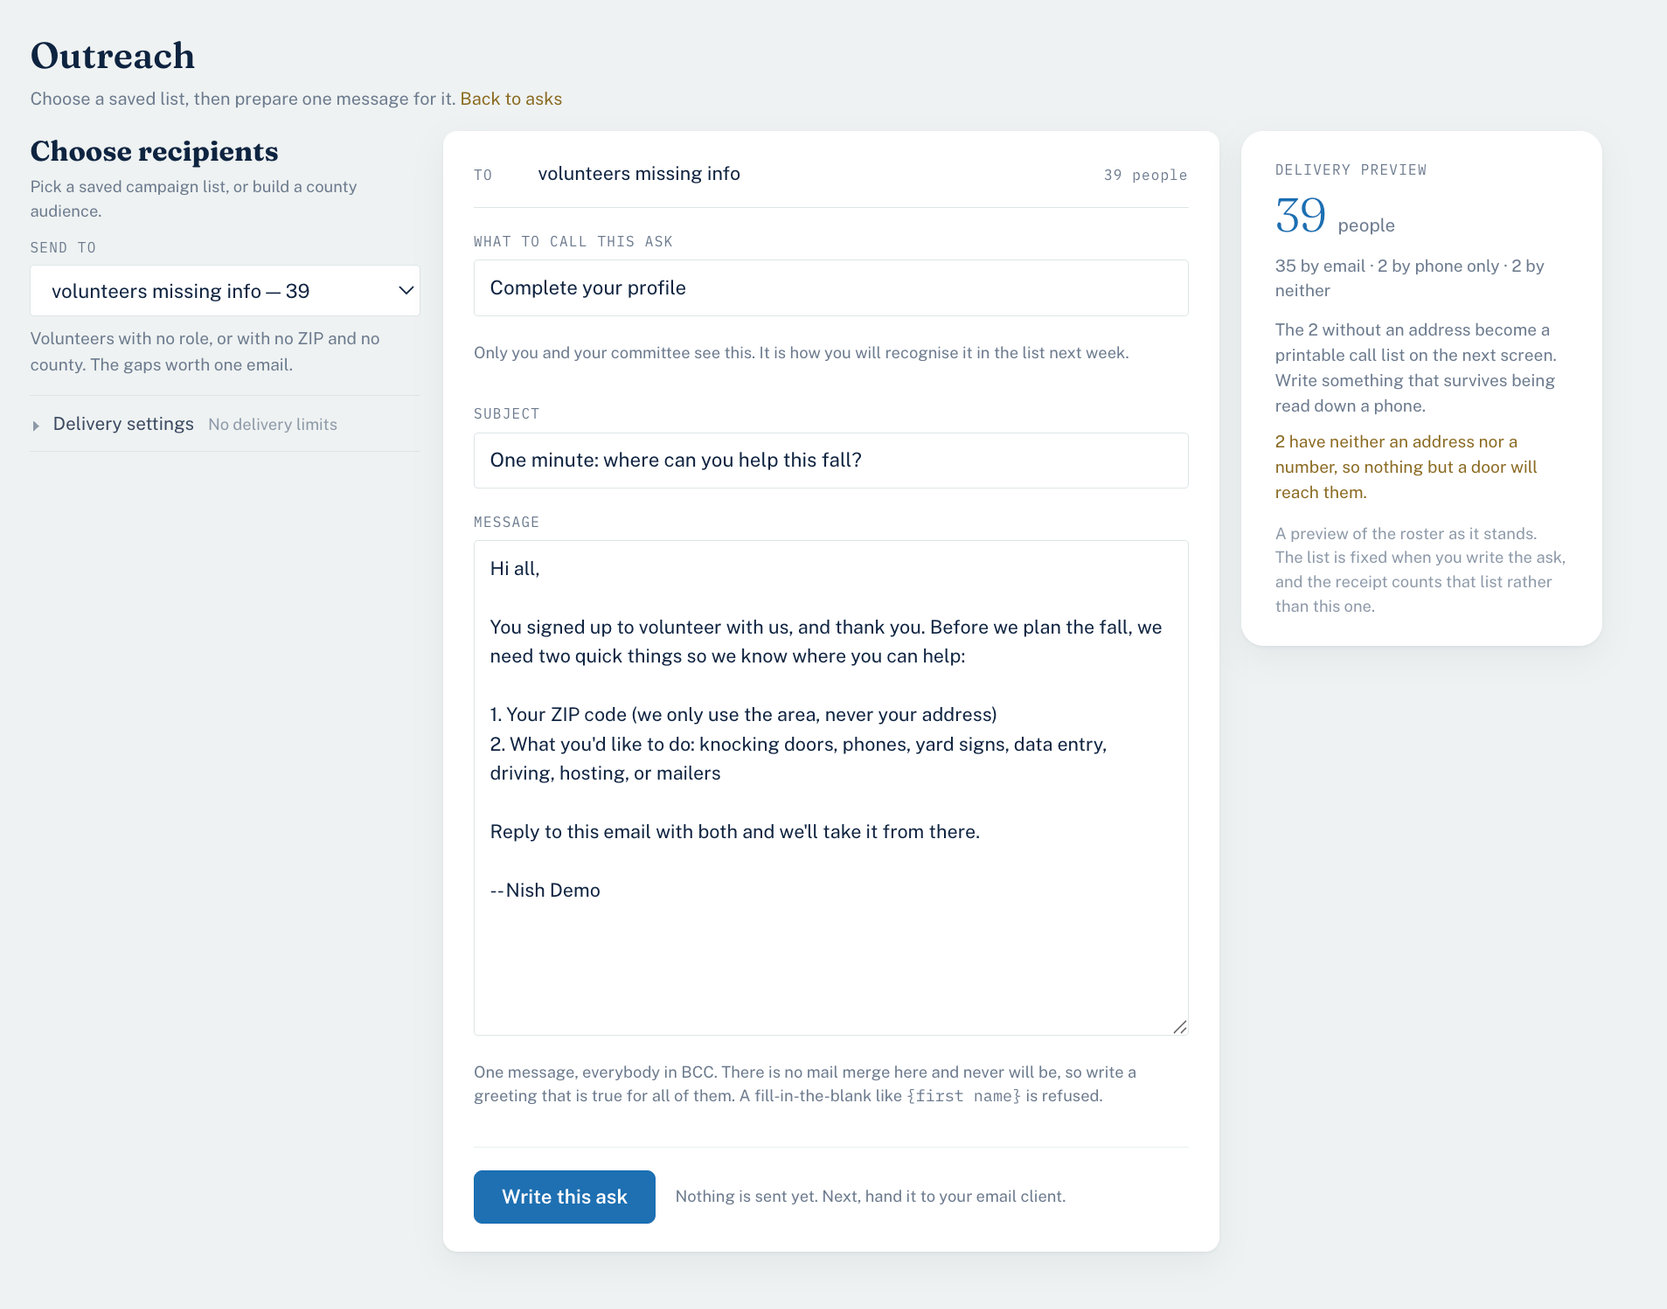
InvolveOS screenshots showing mapping (above) and volunteer outreach (right) tools.
InvolveOS is now live with five organizations: two congressional campaigns, a state house campaign, and a county party in Pennsylvania, plus, as of last week, a statewide campaign in Kansas. Between them, the platform holds more than 3,700 volunteer records across 31 Pennsylvania counties, and the first volunteer asks have gone out through the tool. The first paying campaign, Bilger for Congress in PA-15, is also where Nish started as a postcard writer. He's recently been introduced to the state party's executive director and is in early conversations with Higher Ground Labs about what it would take to build InvolveOS for rural campaigns beyond Pennsylvania.
Learning by asking
What's notable about Nish's summer isn't just that he built a product. It's how he found the problem in the first place. He walked into a local Democratic office with no political background and asked how he could help. Then he kept asking: What's not working? What takes too much time? What do you wish you had?
When Nish asked a rural state house candidate how she recruits volunteers, her answer was four words: "I just asked people." In some ways, that's also how Nish built InvolveOS. He walked into a space he knew little about, found the people doing the work, asked where they were getting stuck, and started building solutions. The transferable skill isn't knowing the answer before you arrive. It's being able to get up to speed in an unfamiliar space, figure out what problems are worth solving, and quickly make yourself useful.
Nish is looking to connect with former campaign managers and candidates from rural counties, and with anyone who has worked with a state party on down-ballot support. If that's you, reach him at me@nishbarot.com.
She Started with a Book-Lending App. Research Led Her Somewhere Better.
Uraiba Zafar is a recent graduate of Pratt Institute's MS in Information Experience Design program and her Hack Your Summer project started with a very specific New York City problem: books take up a lot of space in a small apartment!
Uraiba Zafar is a recent graduate of Pratt Institute's MS in Information Experience Design program and her Hack Your Summer project started with a very specific New York City problem: books take up a lot of space in a small apartment! She kept wishing there were an easier way to pass them along to friends instead of letting them sit unread on a shelf. That frustration became the seed for a book-lending platform.
But before designing anything, Uraiba's first move wasn't to start building. It was to write a PRD, or Product Requirements Document, with her assumptions stated plainly, put together a real research plan, and find out whether the problem she thought she was solving was actually the problem people had.
That research is what changed everything. And Uraiba said: "I'm really glad I did."
Over about a week, Uraiba gathered 41 survey responses, conducted 5 user interviews, and met with 3 mentors through Hack Your Summer. What she found surprised her. People rarely borrow books. When asked what they'd do first if they could see all their friends' books, only one person said they'd borrow one. Most said they'd look for recommendations. In fact, 83% of respondents said they trust friends most for book recommendations, more than any algorithm or review site. The behavior people actually wanted wasn't lending. It was knowing what the people they trust are reading.
How Uraiba Did the Research (and How You Can Too)
If you're at the planning stage of your own project and don't know where to begin with user research, remember that “research” doesn't need to be big or formal to be useful. Here's what worked for Uraiba:
Write down what you believe before you ask anyone. Uraiba wrote a short PRD with her assumptions stated plainly ("people want to lend books to friends"). That gave the research something to prove or disprove instead of just collecting opinions.
Ask about behavior, not the idea. She didn't ask "would you use a book lending app?" She asked how often people had lent or borrowed a book in the last year, how they found their last great read, and who they trust for recommendations. That's how the pivot surfaced: the data on lending behavior and the data on recommendations pointed in completely different directions.
Keep the survey short and go where your users already are. Uraiba’s survey was 14 questions, mostly multiple choice, with an optional email field at the end for anyone willing to do a follow-up interview. That one field is how she recruited interviewees. The best responses came from the two Brooklyn book clubs she's part of, people already gathered around the exact behavior she was studying. Forty-one responses in a few days. If a community for your users already exists, go there first.
Write an interview guide, then let people go off script. Her interviews ran 30 to 45 minutes and were organized by behavior, not by feature: how people discover books, what they own, whether they lend, how they talk about reading. Almost every question was "tell me about the last time you..." because people are bad at predicting what they'd do and good at remembering what they did. The two most useful moments were a ranking exercise (if an app could only do one thing well, which?) and a future-state question (if you could see every book your friends own, what would you do first?). Borrowing came last in both, every time.
Use your mentors as a research step. Uraiba connected with eight mentors through Hack Your Summer, and those conversations counted as much as the formal interviews. In your own work, this may be where connecting with a handful of experts could have an outsized impact.
Set a decision date and stick to it. She gave herself a week, then moved back from research mode to building. Research that doesn't end in a decision is just reading.
So, instead of focusing on lending, Uraiba’s project became a social reading platform centered on trusted recommendations and shared reading experiences, more intimate than Goodreads (which can feel like a public performance), more purposeful than a group chat, and more personal than any algorithm. Lending books didn't disappear from the product entirely (it's still there for the people who want to hand a book to a friend over coffee), but it's now one piece of a much larger social reading experience rather than the core premise.
One of the biggest friction points Uraiba wanted to solve through design was the tedium of manually cataloging a personal library, a first step that kills adoption before anyone gets to the good part. Her solution: an AI-powered bookshelf scanning experience where you point your camera at your physical shelf and it instantly builds a digital library. From there, users can organize their books, browse their friends' libraries, recommend titles, and start reading together.
Before you can browse your friends' shelves or get a recommendation from someone you trust, you need a shelf of your own. Lent With Love makes that part take about ten seconds: point your camera, and every book on your shelves is catalogued automatically.
Uraiba came into Hack Your Summer as a designer, not a developer. She left with a live app on TestFlight, a research methodology she can use on any future project, and a product that exists because she was willing to let her original idea be wrong.
Lent With Love is now live as a public beta on TestFlight.
You can try it here: https://testflight.apple.com/join/Tp9Fmszp.
Three Projects, Three Completely Different Kinds of Work
Not every project in Hack Your Summer looks like the others. These three are from the same session, built in the same four weeks, and they have almost nothing in common except that each one started as an idea someone cared about enough to actually build.
Not every project in Hack Your Summer looks like the others. These three are from the same session, built in the same four weeks, and they have almost nothing in common except that each one started as an idea someone cared about enough to actually build.
Mapping Where Stroke Risk and Care Deserts Overlap
Every 40 seconds, someone in the United States has a stroke, and their chances of surviving and recovering well depend heavily on how quickly they can reach care. That gap between risk and access is exactly what the Stroke Burden Index was built to make visible.
Jane came in with a clear question: where do high stroke risk and poor access to care overlap worst? She posted the idea on day one, teammates joined within hours, and together the team — Jane, Cathleen, Mikko, Nitya, and Ngan — built a polished, publicly accessible site that scores all 91 counties across New York, New Jersey, and Connecticut on a combined index of stroke vulnerability and care access. The dashboard draws on data about local demographics, health risk factors, and distance from healthcare resources to surface the specific communities where public health intervention would have the highest impact.
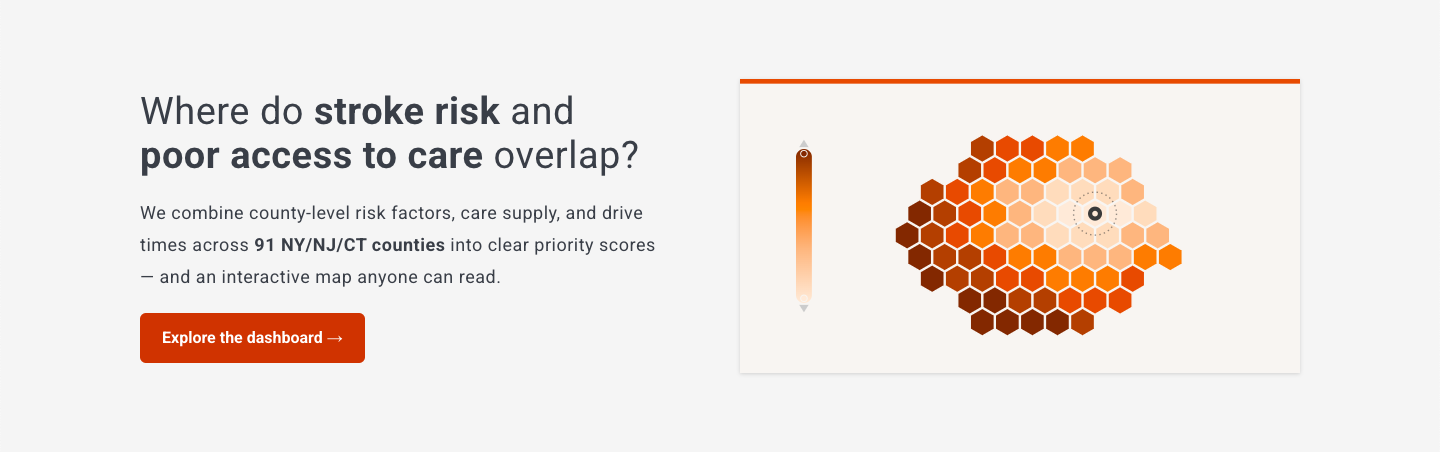
The Stroke Burden Index main page, accessible at https://palism1.github.io/stroke-burden-index/
The finding they published is specific and striking: 12 stroke care deserts — high risk and poor access — all in rural upstate New York. The results can support public health planning, healthcare resource allocation, stroke system planning, and future research by highlighting communities where targeted interventions may have the greatest impact.
The full site includes an interactive dashboard, a plain-language methodology page, a documented data pipeline drawing on CDC, Census, CMS (Centers for Medicare & Medicaid Services), HRSA (Health Resources and Services Administration), and state stroke registries, and a reproducible automated pipeline that keeps every number traceable. This is the kind of work that takes months in a research setting. This team shipped it in four weeks, documented it thoroughly, and made it publicly available for anyone to read.
A Free Store, Made Easier to Find and Use
Cleo is an Ada Comstock Scholar at Smith College, a program for non-traditional students returning to higher education as adults, where their focus is on critical disability studies and interdisciplinary design.
Cleo’s Hack Your Summer project didn't involve code. It didn't involve a dataset. It involved walking into Redistro, a mutual aid collective and free store in their community, and asking: what would it take to make this space genuinely welcoming and accessible to everyone who needs it?
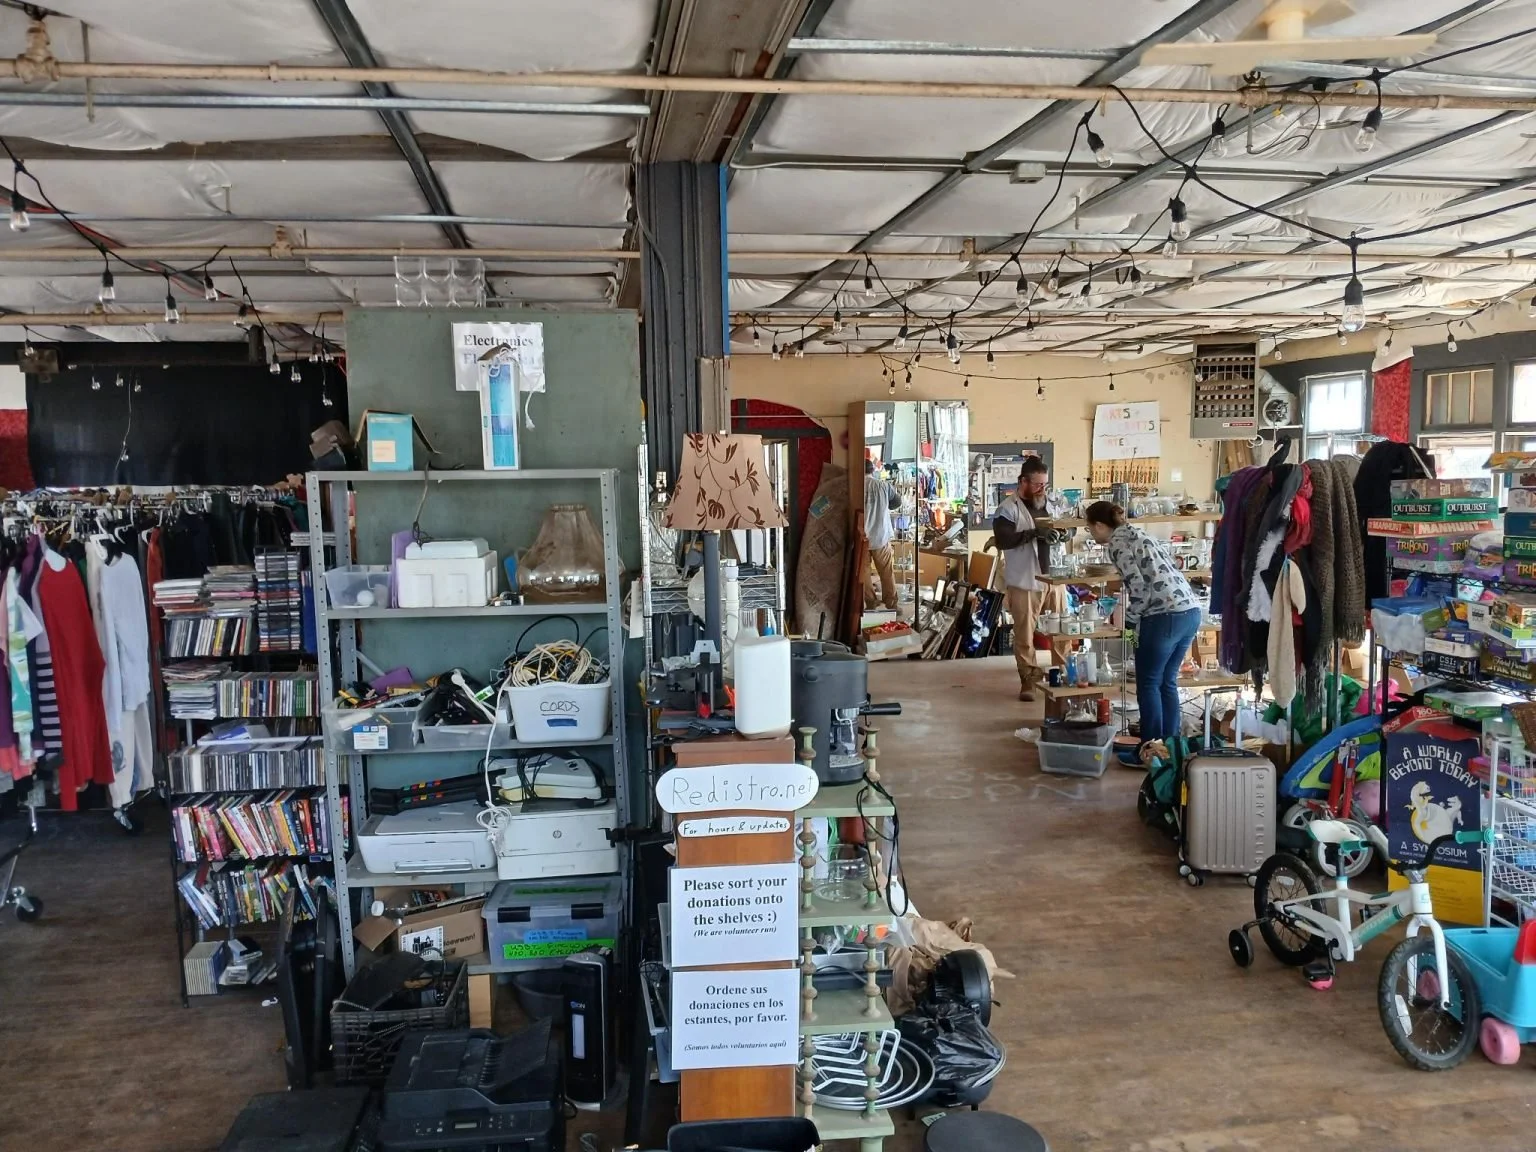
View of the interior at Redistro (photo via https://redistro.org/photo-gallery/)
The store is a real resource. But it's also hard to find on Google Maps, lacks signage, and can be difficult to navigate once you're inside. Cleo's project includes UX research through surveys and interviews with both visitors and organizers, a logo redesign for physical and digital wayfinding, exterior signage, and a full interior access map.
The plans for access mapping work alone are comprehensive: a physical map near the entrance, an audio guide with both conventional and QR code options, tactile elements, color-coded store sections with matching signage, and large-print versions of everything. Each of those is a design decision that requires thinking carefully about who the store actually serves and what barriers they face, rather than designing for a generic visitor who doesn't need any of it.
Cleo worked in Figma, ran accessibility surveys with store visitors, and coordinated directly with Redistro's organizers throughout. The project is scoped to continue well beyond the four weeks of HYS, with the program serving as the starting point for a longer-term design relationship with the organization.
Turning Litter Cleanup Into a Game
Early in the session, Ishi posted an idea for a sustainability project in our HYS Discord. Ella replied that same day, and by the end of the first week a team of four, Ishi, Ella, Trey, and Neha, had decided to build it together. Trey, a recent UNC grad in CS and Studio Art, brought UI/UX experience. Ishi, also at UNC, took the lead on the backend. The concept was simple enough to sketch on a napkin: what if picking up litter worked like Strava, with sessions, stats, streaks, and a reason to keep going?
The app they built is called Litter Quitter, a cross-platform mobile app that gamifies community litter collection. It runs on React Native and Expo, uses GPS to track cleanup sessions in real time, lets users drop pins at pickup locations with optional photos, and accumulates points redeemable for local business coupons. On the backend, the team is building out a FastAPI service backed by PostgreSQL to handle the shift from local device storage to a shared, persistent data layer.
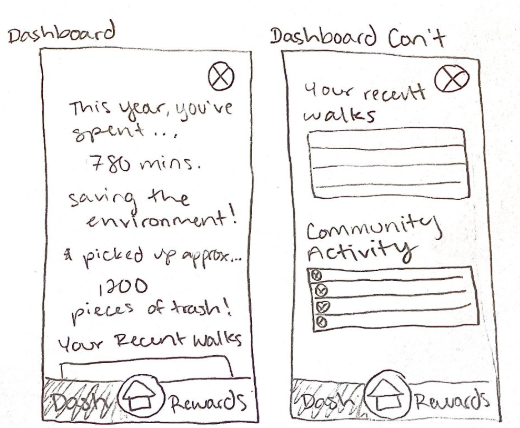
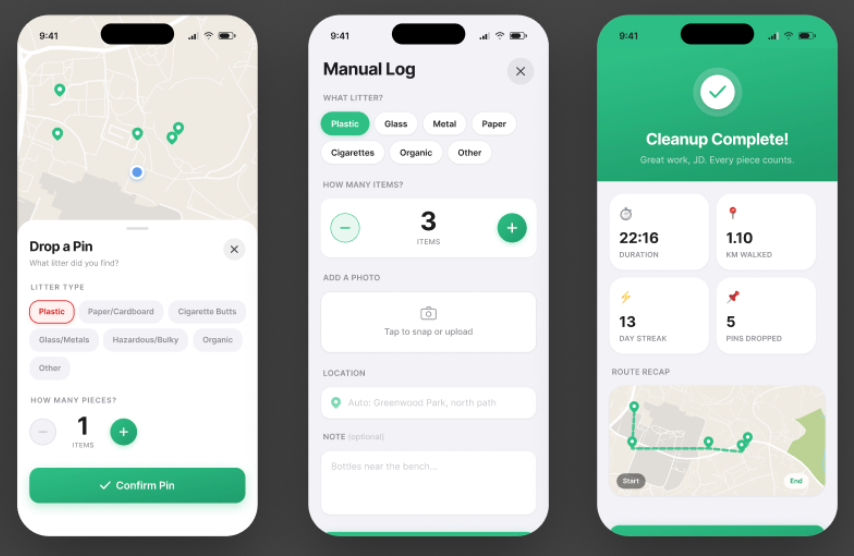
From napkin sketch to working prototype: early wireframes for the dashboard (left) alongside the current build (right), showing session stats, streaks, and recent walk history.
Personal stats, day streaks, community-wide impact totals, and leaderboards give users a reason to come back. The idea behind the rewards system is to loop in local businesses as partners, turning litter cleanup into something that benefits the whole neighborhood, not just the people picking things up. The team is actively working on bringing businesses on board, formulating interview questions and talking to potential users to understand what would make the partnership worthwhile on both sides.
By week three, the team had a working single-user prototype with a live map feature. Looking ahead, the team is also exploring a choropleth map that would shade neighborhoods by litter density, giving users a visual read on where cleanup efforts are needed most. The next problem was a hard one: How do you turn a working demo into a real multi-user platform with real data? That gap, from "it works on my phone" to "it works for everyone," is where a lot of apps stall out. The core of the idea is real enough to use and the team is still working through it as they continue with our second 4-week sprint.
The Stroke Burden Index, Redistro Accessibility Visioning, and Litter Quitter were all built during Hack Your Summer Session A, 2026.
Sorting It Out: Solving a Recycling Problem from Two Angles
Andrea and Abhay never formally teamed up during Hack Your Summer. They worked on separate projects, in separate tracks, with separate goals. But they were both trying to solve the same underlying problem: recycling sorting is broken, and technology should be able to fix it.
Andrea and Abhay never formally teamed up during Hack Your Summer. They worked on separate projects, in separate tracks, with separate goals. But they were both trying to solve the same underlying problem: recycling sorting is broken, and technology should be able to fix it. So they stayed in conversation throughout the program, sharing resources, comparing notes, and exploring the problem from complementary perspectives, each going deep on the parts that matched their own skills and interests.
Andrea: Teaching a Model to See Recycling
Andrea, who recently completed her Master of Science in Analytics at Georgia Tech, came in knowing she wanted to work with computer vision in an industrial setting but not yet sure how. Through conversations with Abhay, she found something she wanted to solve. The problem was specific and real: Materials Recovery Facilities (MRFs, the places that actually process the single-stream recycling you put in your bin) have to sort incoming material fast and accurately, and contamination between material types is a serious, expensive problem. She spent the first couple of weeks researching object detection models before landing on YOLO11, a fast, real-time detection architecture developed by Ultralytics well suited to high throughput conditions.
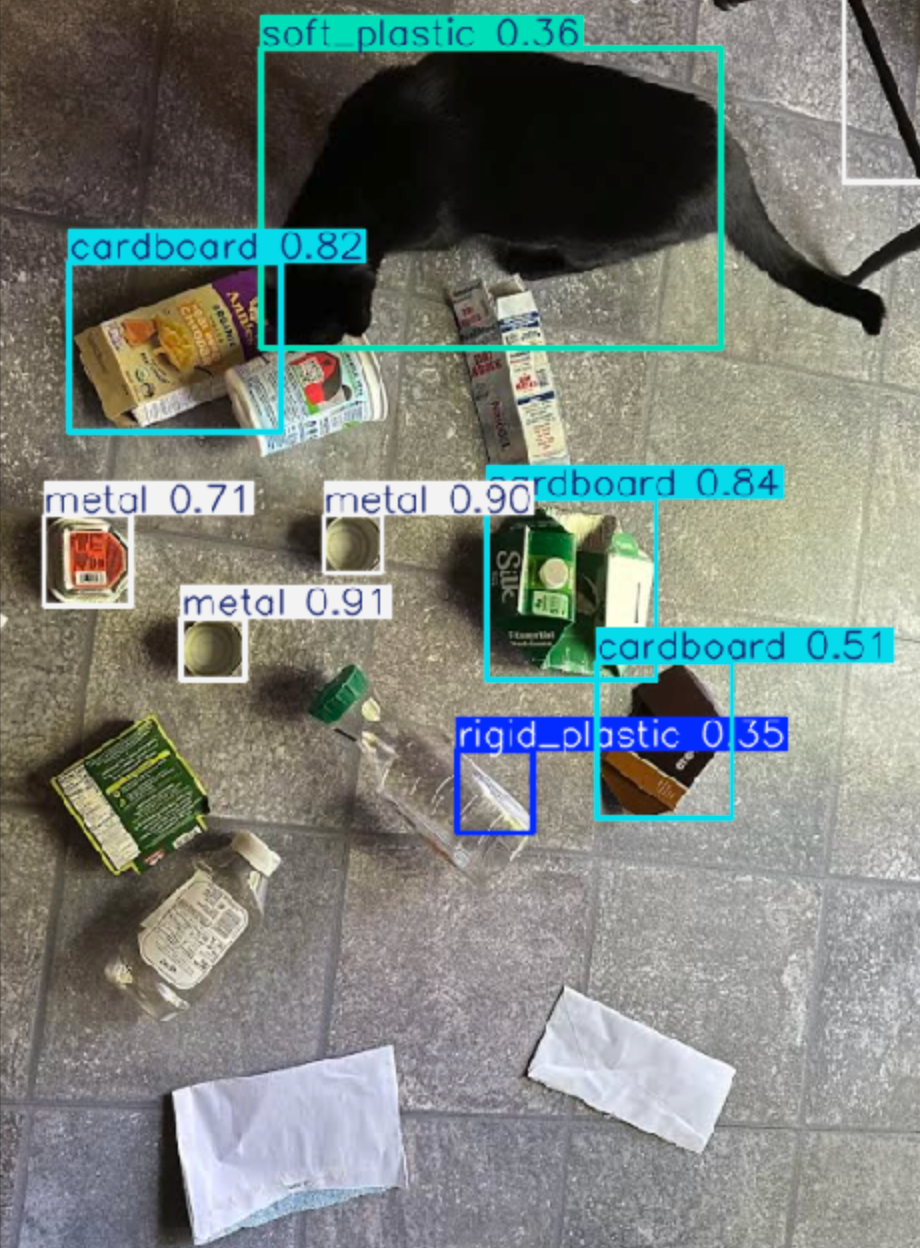
Andrea couldn't visit a MRF but she still got to know her datasets by interrogating her own recycling bin. Here her cat is helping investigate and has been classified by Andrea’s first model as “soft plastic”. (It has since been confirmed that cat is soft but not plastic.) This classification error makes sense when you look at the dataset used to fine tune the model.
Finding the right dataset took just as much effort. Ultimately she chose the ZeroWaste dataset from Boston University, built specifically to capture the extreme clutter and highly deformable objects found in real MRF environments, and augmented it with items from the TACO dataset (Trash Annotations in Context, an open image dataset of litter taken under diverse environments) to address class imbalance. She converted the ZeroWaste dataset into YOLO format with four classes (rigid plastic, cardboard, metal, and soft plastic), and fine-tuned her own YOLO11 model on it.
Then she ran it! Fifty epochs, on her own computer, over six hours of training time. The results were promising enough to make the next problem clear: she needed to speed up hyperparameter optimization, and started researching Optuna, an open-source framework for automating that search, as the next step.
By the end of the session, Andrea was also sitting with a bigger question: what does it actually mean to learn when AI is doing the coding for you? A HYS mentor offered a response that stuck with her: you're still bringing your own knowledge and curiosity, and that's what lets you push back on the AI and ask better questions. She finished the session wanting to slow down enough to understand what her YOLO model was actually doing, not just whether or not it worked. Andrea plans to use this as an opportunity to learn how to build with AI while deepening her own skills and knowledge.
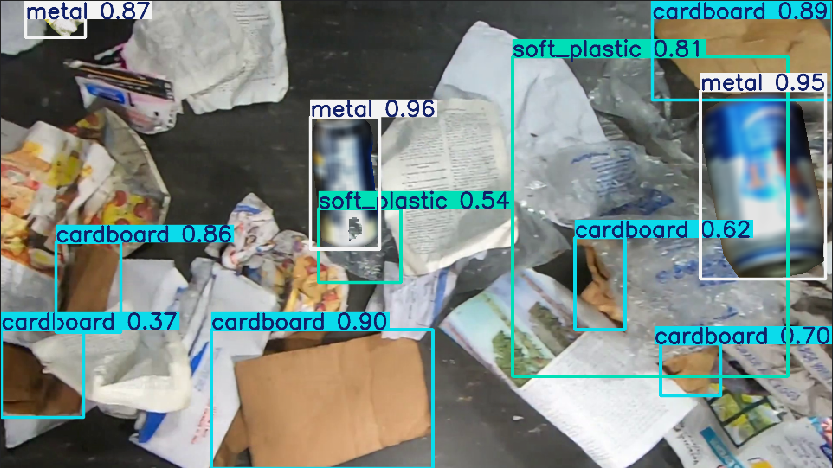
Sample image from ZeroWaste dataset, labeled by fine-tuned YOLO11 model.
Abhay: Building the Machine That Does the Sorting
Where Andrea was training a model to identify materials, Abhay was building a physical system to act on that identification. A mechanical engineering sophomore at Cal Poly San Luis Obispo specializing in mechanical design and hardware, he came in without a settled idea, so he began reflecting on problems within his own community. After experiencing the challenges of his university’s inefficient recycling system firsthand, Abhay developed the idea for AutoSort and quickly committed to bringing it to life.
His scope narrowing was deliberate and engineering-minded: instead of sorting all recyclables, he focused exclusively on aluminum and glass, the two material types with the highest recovery value in real recycling economics. The device uses sensors to identify incoming material, with an Arduino Uno translating that sensor feedback into precise movements from servo motors that physically separates it accordingly. Abhay’s comfort zone was the hardware: the circuit schematics, the mechanical design, building the physical sorting mechanism. The biggest stretch came from integrating sensors and building the machine learning model to classify incoming materials. He trained the model offline in Python on his computer before deploying it as a compact on-device classifier that could make sorting decisions in real time, the same underlying challenge Andrea was working through from the software side.
AutoSort in action. An Arduino Uno translates sensor readings into precise movements from the servo motors, allowing the prototype to identify incoming material and physically sort it in real time.
By the final weeks he had a working prototype, sensor and sorter together, distinguishing aluminum and glass from other materials in real time. The video of an apple core and a piece of aluminum foil moving through the device and getting correctly separated shows that AutoSort was a big step in the right direction toward solving the problem.
In building AutoSort, Abhay learned that the engineering process is rarely linear. Sometimes progress meant making the system work; other times, it meant finding ten new ways it could fail.
Collaboration: Another Kind of Teamwork
What makes this pair of projects notable isn't just that two people worked on similar problems. It's that they recognized the overlap early and kept learning from one another throughout the program. They stayed in conversation throughout, sharing datasets, comparing approaches, and helping each other think through decisions neither had to make alone.
They weren't a team. But taken together, their work illustrates another kind of teamwork: independent builders making each other's work better simply by building alongside one another. That's exactly the kind of connection Hack Your Summer hopes to create.
Andrea Wackerle's computer vision for recycling sorting project and Abhay Sivaraman's AutoSort prototype were developed during Hack Your Summer Session A, 2026.
An Archive Built by Many Hands
Every community has people whose stories rarely get written down. Millie set out to change that with The Living Index, a literary archive built around short portraits of everyday people. With help from two Hack Your Summer teammates, she turned the idea into a working platform. Now, anyone can contribute a story and help grow the archive.
Millie showed up to Hack Your Summer without a team and without knowing how to build a platform. She had an idea, though: a literary archive made of short portraits of ordinary people, written by the people who know them. A retired schoolteacher. A bodega owner. A bartender who remembers your order. She didn't know yet what form it would take, only that she wanted a way to preserve those kinds of stories.
She found Spencer, a recent UX design grad who was still hunting for a project of his own. A few days later, Deepi, an art history student with a strong instinct for how stories hold together structurally, joined too. None of them had worked together before.
The team came together the way most real projects do, through conversation, not assignment. Millie shaped the editorial voice and the submission process. Spencer turned it into an actual interface. Deepi thought about how the whole archive should function as a system, the kind of structural thinking her art history background was good for. Building from three different design vocabularies wasn't free. Handing off files between someone with a UX degree, a journalism/anthro major, and an art historian took some effort to sort out. But it also meant nobody had to bring everything themselves.
By the end of two weeks, they'd already shipped an MVP version of The Living Index, a website where anyone can submit a portrait of someone in their life, have it reviewed, and see it published to a permanent map. Along the way, the sharpest question they got wasn't about design. It was about who owns a portrait once someone else writes it. That's the kind of question a project only earns once it looks real, and the team took it seriously, folding it into how they thought about editorial review from then on.
The Living Index home page, where you can access the live archive.
Overnight, Millie didn't become a programmer, Spencer didn't become a journalist, and Deepi didn't become a UX designer. That was never the plan! But they built The Living Index anyway, together, with each doing the part only they could do.
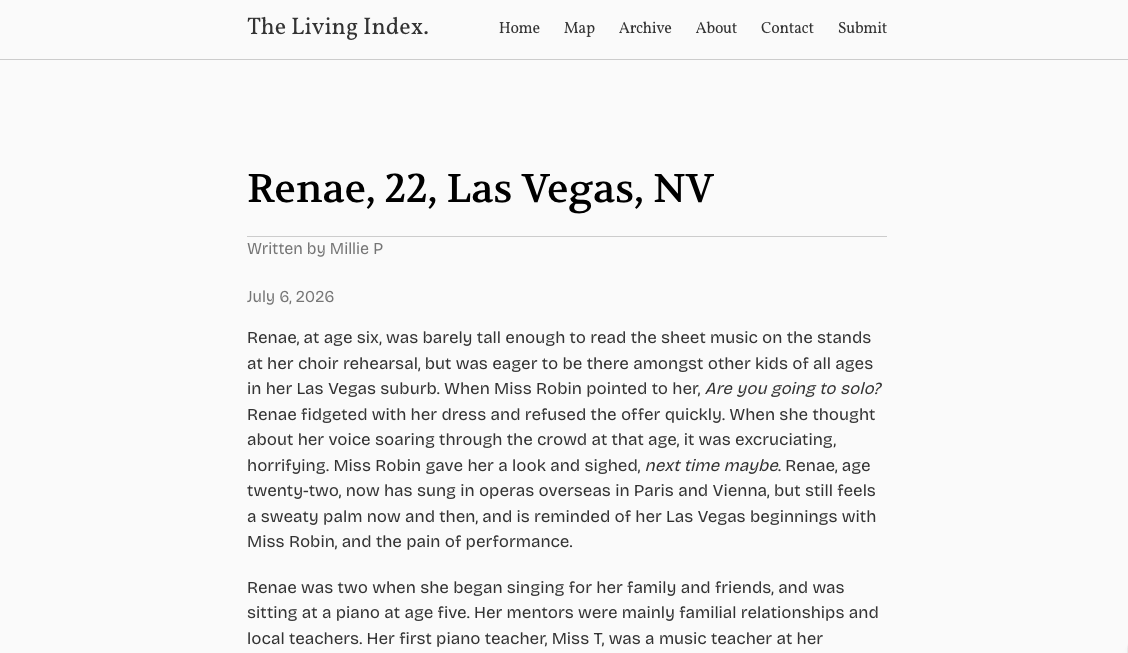
The first portrait submitted by Millie on The Living Index, now available to read here.
Want to Get Involved?
If there's someone in your community whose story deserves to be remembered, a neighbor, coworker, family member, or familiar face from your block, The Living Index wants to hear about them. You don't need to be a writer. You just need to be someone who's paying attention. The site includes a simple submission template to help you get started.
The living Index is also looking for collaborators with experience in social media, storytelling and publishing, illustration and design, web or product development, and legal or consent advising. It's an early-stage project with plenty of opportunities to help shape what comes next, including future plans for audio storytelling.
To contribute, get in touch through The Living Index website or email Millie at emileepolzin@gmail.com. If you're an early-stage investor interested in supporting the project, she'd love to hear from you too.
The Living Index is open. Come share who matters to you.
Mind the Gap: A Transit Project in Progress
A graduate student interested in climate and urban systems, Sasha arrived at Hack Your Summer with three project ideas. After getting feedback from the community, she narrowed her focus to one city she knows well: Tampa.
That decision became the foundation for a sophisticated transit equity dashboard, and a lesson in why the best projects often begin by thinking smaller.
Sasha Patil didn't spend her first week at Hack Your Summer building. She spent it figuring out what was worth building.
A graduate student interested in climate and urban systems, Sasha arrived with three ideas and posted them in the HYS Discord looking for feedback. The advice she got back was simple: stop thinking about the whole country. Pick one place.
She chose Tampa. It wasn't a random decision. Sasha lives in the area, and she wanted to build something that could be useful to the people and communities she already knew.
As she dug into the data, the project evolved. Instead of asking where extreme heat would hit hardest, she found herself asking a different question: where do people most need public transit, and where is it falling short?
The result was the Tampa Mobility Gap Explorer, an interactive dashboard designed to help City of Tampa and Hillsborough County planners visualize gaps in transit access.
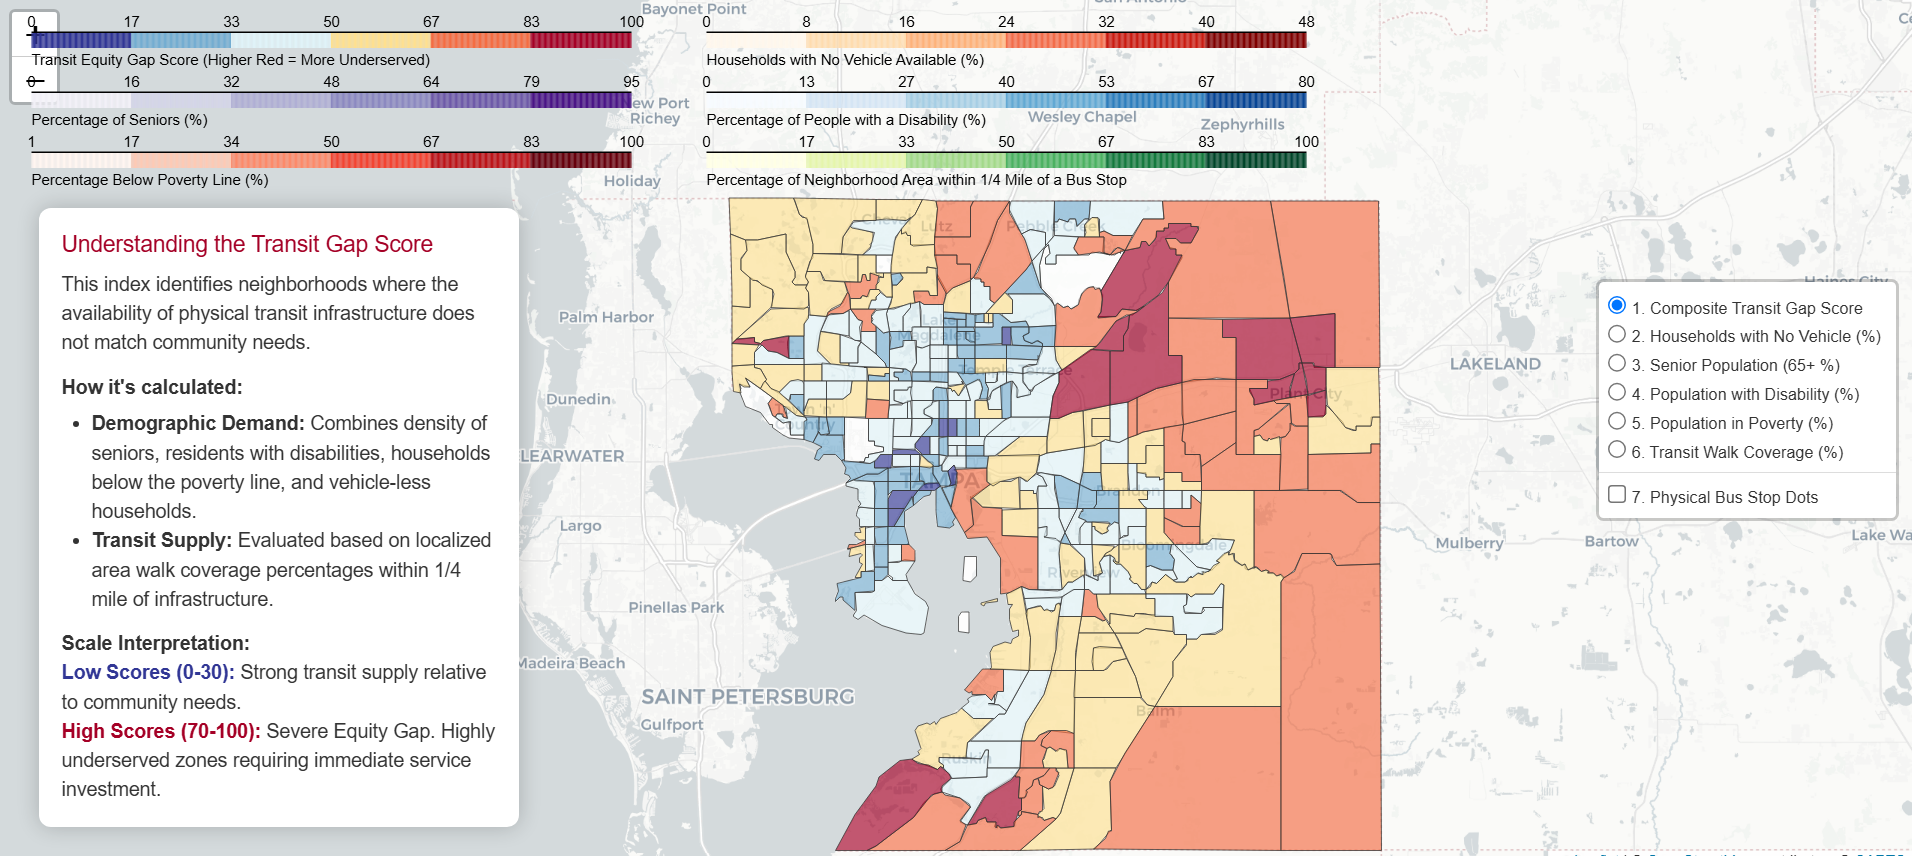
The dashboard's main view displays a Transit Gap Score from 0–100 for every census tract, combining factors like household vehicle ownership, disability rates, income, and proximity to bus stops. Planners can also explore each underlying layer individually.
The Explorer layers a transit system map with information about the people who are most likely to rely on it, including age, income, disability status, and household vehicle ownership. It also highlights major employment centers to identify neighborhoods where better transit could have the biggest impact on connecting residents to jobs.
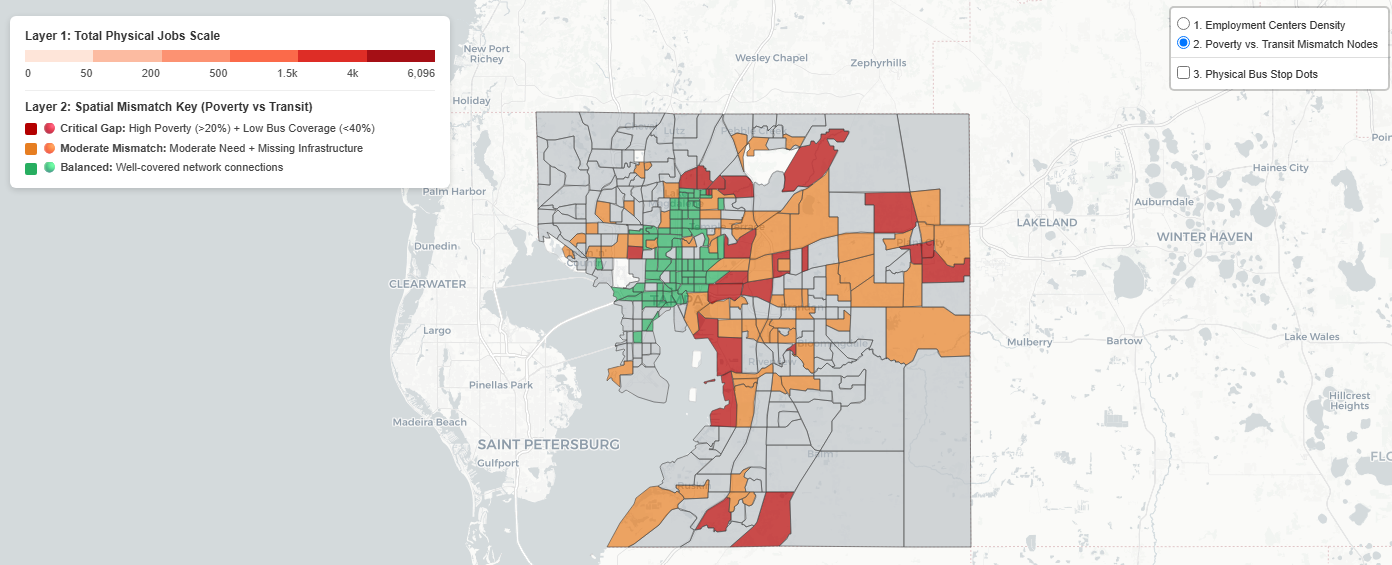
Here, the dashboard highlights neighborhoods where poverty rates are high but transit access is limited. The color-coded map helps planners quickly identify areas with the greatest transportation gaps.
Behind the scenes, Sasha combined multiple public datasets into a single interactive tool and developed a Transit Gap Score to identify places where high community need, nearby jobs, and limited transit overlap. The result is more than a map. It's a way to help planners prioritize where future transit investments could make the biggest difference. The platform also features an Infrastructure Scenario Simulator that lets planners test potential improvements and see how neighborhood accessibility changes.
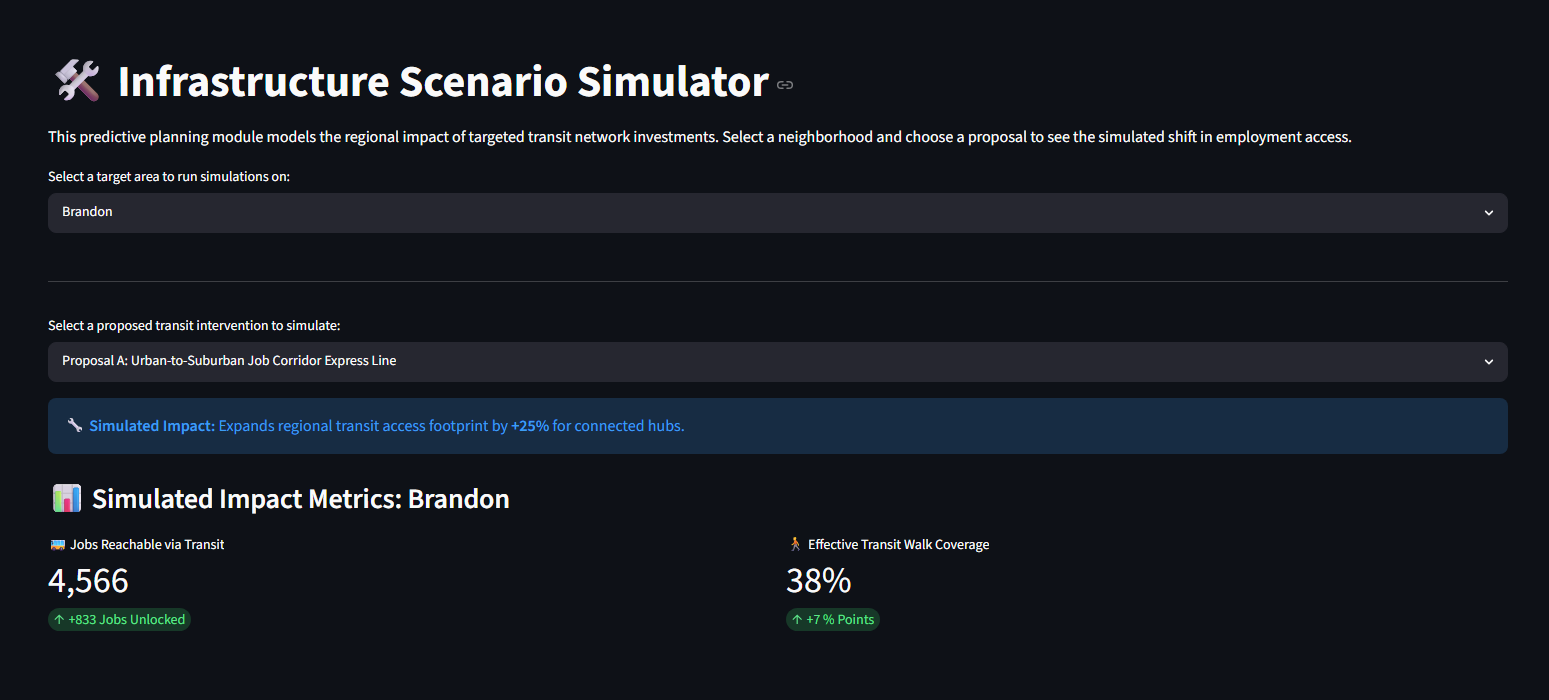
The Infrastructure Scenario Simulator lets planners select a neighborhood and test a proposed transit investment. The dashboard estimates outcomes such as newly accessible jobs and improvements in neighborhood walkability.
Just as importantly, Sasha documented the work the way professional teams do. Her GitHub repository includes the underlying census and transit datasets, a modular Python pipeline with clearly separated processing steps, and the deployed interactive dashboard. By sharing the full workflow, Sasha makes it easy for others to understand how the project was built, reproduce the results of her analyses, and build on her work. The repository tells the story behind the dashboard, making it a much stronger portfolio piece than a finished visualization alone.
Like many Hack Your Summer projects, this one changed shape as Sasha learned more about the problem she wanted to solve. Sasha shared rough ideas before she had anything built, accepted feedback that meant narrowing her scope, and let the project become something different from what she originally imagined.
That's often what building looks like. The best projects don't always begin with the perfect idea. They get better because you're willing to ask for feedback, change direction, and focus on solving one real problem for one real community.
The Tampa Mobility Gap Explorer is still evolving, but it's already a great example of starting small to solve a meaningful problem. Rather than trying to improve transportation everywhere, Sasha focused on one city she knows well, and built something that could make a real difference there.
Interested in building something for your own community? Registration for Hack Your Summer Session 2 closes Friday July 10 at midnight Pacific. We'd love to see what you can build.
The Right Teammate Can Change Your Project
When Mateo joined Hack Your Summer, he wasn't looking for something to build from scratch. He was looking for an engineering problem.
A day later, he found Nathan.
When Mateo joined Hack Your Summer, he wasn't looking for something to build from scratch. He was looking for an engineering problem.
A PhD student at the University of Illinois Urbana-Champaign studying aerospace engineering, Mateo spends most of his time thinking about 3D printing, composite materials, and manufacturing. When introductions started in the Hack Your Summer Discord, he posted exactly that. If anyone was building something that needed engineering or fabrication, he'd love to help.
A day later, he found Nathan.
Nathan, an undergraduate studying computer science, had already been developing “ClickSafe”, a personal emergency alert device inspired by products like Life Alert but designed for much smaller communities. Instead of automatically contacting emergency services, ClickSafe lets the wearer alert the people most likely to help first, whether that's family members, trusted friends, or campus security.
Nathan already had the electronics, wireless communication, and an early prototype. What he didn't have was a product enclosure someone would actually want to carry.
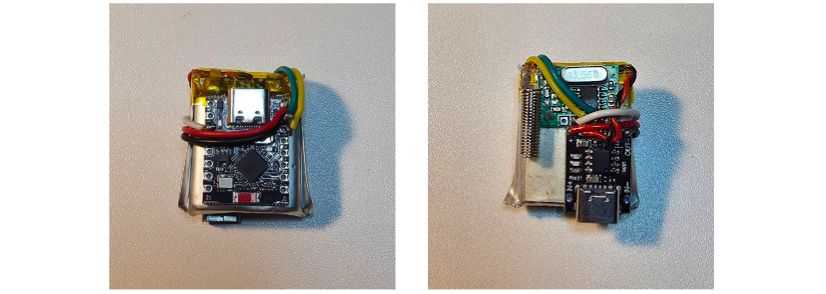
Left: Nathan's prototype esp32 board for transmitter mounted on battery. Right: The other side of the battery with charging port and transmitter.
Mateo immediately saw where he could contribute.
Rather than building another software feature, he offered to redesign the physical housing. They jumped on a video call, talked through the hardware, and naturally divided the work. Nathan focused on the electronics, networking, and embedded software. Mateo took ownership of the enclosure, refining the CAD model and preparing it for 3D printing.
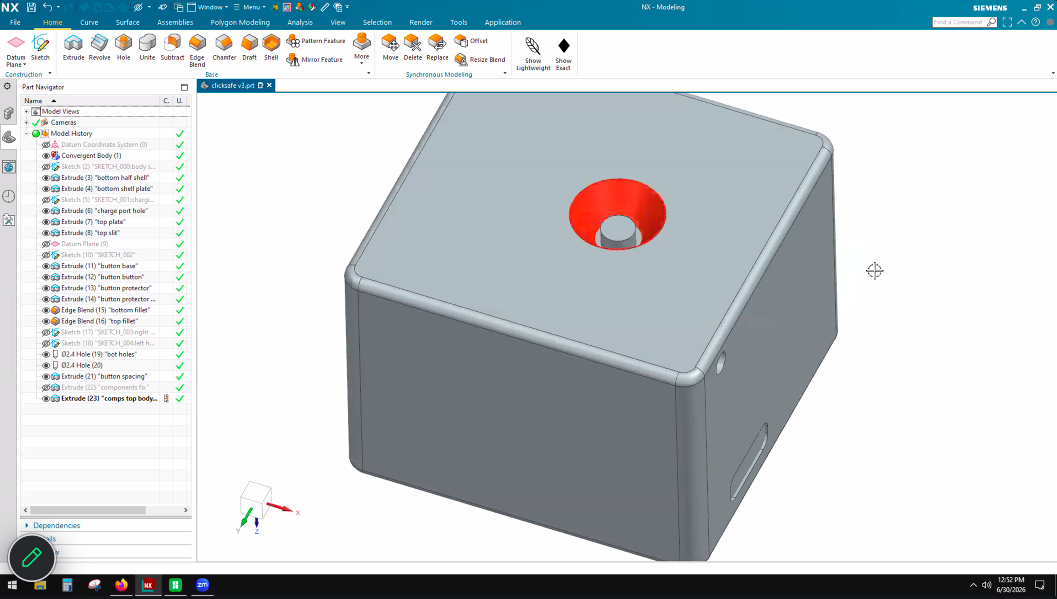
Mateo’s CAD model of physical enclosure for ClickSafe.
It's an easy detail to overlook, but it's one that shows up on real engineering teams all the time. Not every collaborator joins at the beginning. Sometimes the most valuable contribution is recognizing where someone else's project needs your particular expertise.
The project is still evolving. Nathan continues refining the networking architecture while Mateo iterates on the printed enclosure, fixing design issues, adjusting the model, and turning digital designs into physical prototypes that can actually be held, tested, and improved.
That cycle is the reality of hardware development. You don't just write code and press run. Every iteration means redesigning parts, waiting on a printer, testing the fit, discovering the next problem, and printing again.
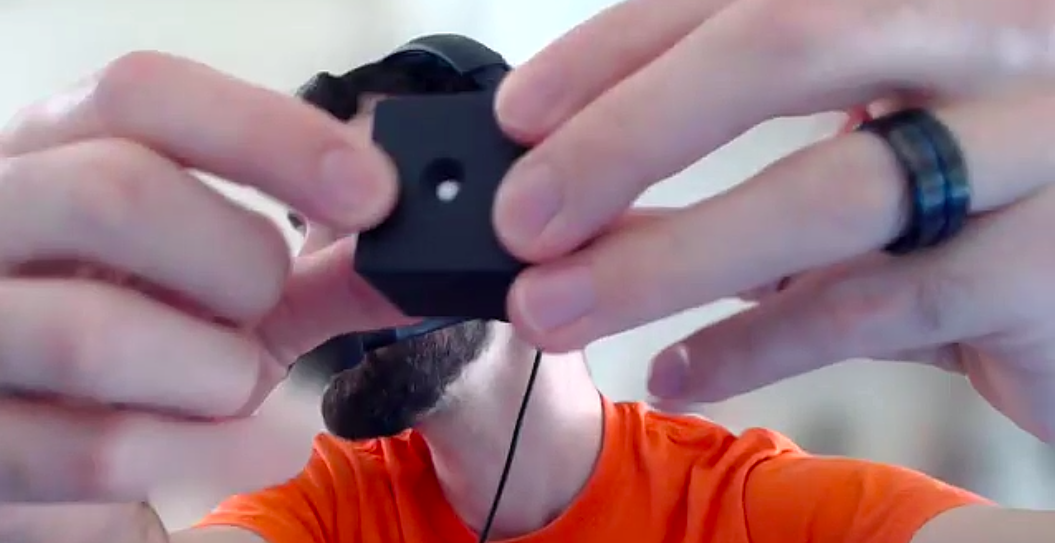
Mateo showing a 3D printing of the ClickSafe enclosure.
As the first Hack Your Summer cohort wraps up, ClickSafe is becoming something neither student would have built alone. Nathan's idea now has a purpose-built physical form, and Mateo found exactly the kind of engineering challenge he was hoping to tackle when he joined the program.
If you're wondering whether you need to arrive with the perfect idea, or whether your skills fit someone else's project, ClickSafe offers a different perspective. Some of the best collaborations begin with a simple conversation. Sometimes the most valuable thing you build during Hack Your Summer isn't your own idea. It's the missing piece that helps someone else's come to life.
Think you'd rather join an existing project than start from scratch? Or maybe you're still looking for the right idea or teammates?
That's exactly what the next Hack Your Summer cohort is for.
Registration for Session 2 closes soon! If you're curious about building something real this summer, now's the time to sign up!